


The Allegro CL Source Stepper
The new Allegro CL Source Stepper is an offering unique to existing Lisp debuggers, and in fact probably unique to source-level debuggers provided by other languages. The new Allegro Source Stepper provides the following:- Debug/stepping info can be loaded on demand, without recompiling the function under debug.
- Assembler instructions can be displayed and stepped.
- Macros are rendered transparent, allowing macro forms as well as all levels of their expansions to fully participate in the debug process.
- Language personalities can be defined and loaded, which customize the debugger behavior for domain specific languages implemented in Common Lisp.
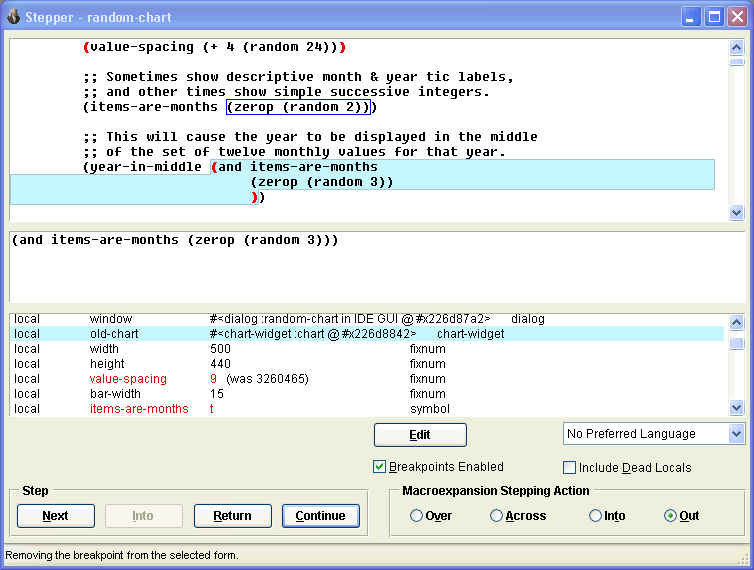
The source stepper displays source code while stepping through a form. When using it with the IDE, (not available on Sparc or AIX platforms) the source stepper is associated with the new Stepper Dialog. The Stepper Dialog allows carefully testing compiled code by interrupting execution at selected forms in the original source code and at macroexpansions of the code, allowing state to be examined at each stop point.
The dialog displays the original lisp source code for a function or method that is being stepped through, highlighting the form at which the stepper is stopped. Button widgets allow proceding in various ways each time execution has been interrupted. The dialog also displays macroexpanded forms and the values of arguments and local variables, updated after each step. The IDE's code editor can be invoked at any time on the code being stepped through.
The dialog is implemented on top of the base lisp's stepping facility, which also has a simpler textual interface that can be used in a lisp listener. See The Lisp DeBug (ldb) stepper and The source stepper, both in debugging.html.
Stepper Dialog Example (click on picture to enlarge)
The Definition Pane
The Definition Pane (at the top of the dialog) shows the source code for the function or method that's currently being stepped through. This is a copy of the real source code text, complete with comments and original line breaks. The form at which the stepper is currently stopped will be highlighted with a different background color. Red parentheses are drawn around any breakpointed forms. The breakpointable form under the mouse (if any) in the Definition Pane will have a blue border drawn around it.
The form in the Definition Pane where the stepper is stopped is drawn with a background color that can have different meanings. An explanatory note will appear in the dialog the first three times each highlighting color is used. The default color is blue. When green, source-level debugging information is available for the function that the highlighted form will call. This is a "green light" that pressing the Step Into button will continue doing source-level stepping. When orange, you are stopped at a macro form. When gray, it means that no source code range is known for the current step point.
The Form Pane
The Form Pane (second from the top) shows just the form at which the stepper is currently stopped. This form would be executed by a subsequent Step Next. Sometimes this is a form in the original source code, and is the same as the highlighted form in the Definition Pane, and at other times it is all or part of a macroexpansion.
The Stack Pane
The Stack Pane (third from the top) lists the arguments and local variables of the function that is being stepped through, followed by the arguments to the function that called the function being stepped, and then by the arguments to to the next calling function.
Assembly-Language Stepping in the Stepper Dialog
If breakpoints are added to functions for which source-level debugging information is not available, the Stepper Dialog will still display some information and allow stepping to be done.
Documentation
Please refer to the Stepper Dialog documentation for the full details.
| Copyright © 2023 Franz Inc., All Rights Reserved | Privacy Statement | 
|

|

|

|

|