|
Allegro CL version 11.0 | ||||||||
The Project Manager dialog displays information about the current project which is returned by current-project. Most information about projects is displayed and much can be changed by changing fields in the dialog. The Project Manager dialog is displayed by the View | Project Manager menu command.
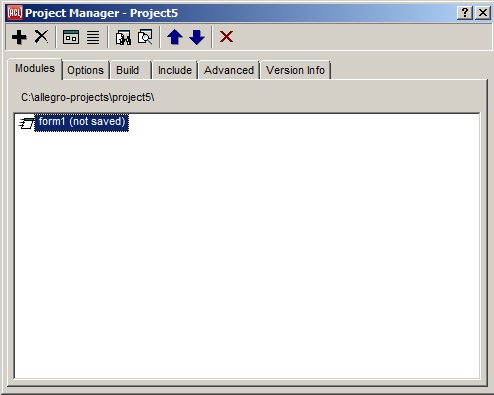
As shown in the illustration, the Project Manager has seven tabs,
The buttons on the Project Manager toolbar are (identified by their tooltip label and, in some cases, their icon):
Add file (a plus): add a module (source, form, subproject, library, distributed file, distributed directory, or editable file) to the project. When using the Project Manager dialog's Add button to add files to a project, you can specify multiple files in the file selection dialog, as long as they are in the same directory, and for the same type of module.
Use the Move Up (up arrow) and Move Down (down arrow) buttons to place the new module in the desired location with respect to other modules.
Remove File(s) (an x): delete the selected object, usually a file, removing it from the project.
Edit Dialog Form: display the selected form.
Edit Source Code: open the form .cl file or the selected .cl file in an editor buffer.
View Project Source: open the project .lpr file in an editor buffer.
Inspect Project: Inspect the project in the Inspector Window (opening or exposing the Inspector as necessary).
Move Up (an up arrow): works when Modules Tab is exposed. Move the selected file up in the list of files.
Move Down (a down arrow): works when Modules Tab is exposed. Move the selected file down in the list of files.
Close the Current Project (a red X): Leaves the IDE running with no current project. When not actively working on a project, a few IDE commands may default more conveniently when there is no leftover current project. See close-current-project.
A tab of the Project Manager Dialog.
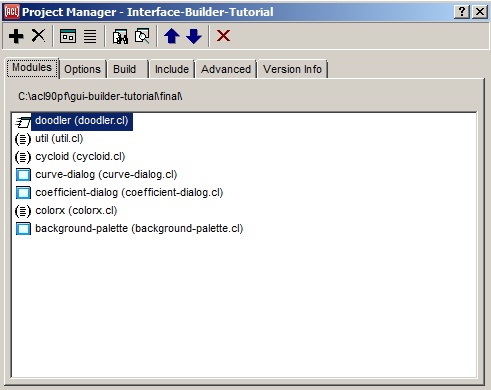
This tab on the Project Manager dialog lists the modules in the project.
The static-text widget at the top of this tab displays the default directory for the project, which is simply the directory that contains the project's .lpr project definition file. The large list widget just below displays the project's modules in the order in which they are loaded. The pathname shown for each module is relative to the project's default directory. (The module paths are stored that way so that they are still correct if the project directory is moved.)
Each module of a project is of one of several standard module types. The types are:
Each type is represented in the Project Manager by a particular icon --- form modules use a "window" icon, source code modules a "lines inside parentheses" icon, and so on. In addition, the main-form of the project uses a window icon that appears to be moving fast, alluding to the fact that this is the form that is initially "run" by the Run | Run Project command (assuming that the default on-initialization function is used). In the illustration above, doodler, cycloid, coefficient-dialog, and background-palette are all form modules, and doodler is the main form. Util, cycloid, and colorx are source code modules. There are no shared library, sub-project, or distributed-file modules illustrated.
A form module contains a .bil file that is automatically generated to provide the finder-function and maker-function for creating the running window of an interactively designed form window, plus (sometimes) a .bml file to hold pixmap data (only when widgets on the form use any pixmaps), and a .cl file that is set up automatically for you to fill in custom event-handler source code and other code associated with the window. A source code module simply contains a single arbitrary source code file. A sub-project module points to the .lpr project definition file of another project that is always used by this project. A shared library module contains a loadable library file into which the project can make foreign-function calls. A distributed file module is an arbitrary file that will be distributed with your application; the File | Build Project Distribution command simply copies this file to the distribution directory along with the runnable files of the project. A distributed directory module is a directory that will be copied along with its entire contents into the standalone app's distribution directory. An editable file module is a file that is neither compiled and loaded nor distributed, but which may be shown in the editor from this list in the project manager, and searched when the Find In Files dialog searches the current project.
Along with the distributed files in the list of modules, two additional files will always be distributed for running in CG/JS mode. One file is browser-not-supported.html, which will be shown if the user tries to run the app in an unsupported web browser (though CG/JS supports all widely-used browsers). The other file is ssl-not-found.html, which will be shown if the OpenSSL libraries are not found when a user tries to run the app in a web browser. (CG/JS communicates with the web browser using the WebSocket protocol, which requires SSL.) You can find the default versions of these files in the distribution that's created for your application by File | Build Project Distribution.
If you are delivering an application, then you will need to replace those files in the distribution with ones that have the same names (browser-not-supported.html and ssl-not-found.html) but are suitable for your app. (The default files are are not suitable, though you could borrow some of the HTML formatting or text from them.) But to avoid replacing those files every time you generate the distribution, it's more convenient to add your custom HTML files as distributed files of your project. When the project system sees files with those particular names in your project, it will copy those (rather than the default files) to the distribution.
The template files from which the distributed files are created can be found in the main Allegro CL directory (even without generating a distribution for a project). In that location, ssl-not-found.html is actually for the IDE, while ssl-not-found-app.html is for applications, though a replacement file in a project must be named ssl-not-found.html.
To add a module to the current project, press the Project Manager Dialog's Add File button (identified by a + sign) on the left end of the Project Manager's toolbar. A dialog appears asking which type of module you would like to add.
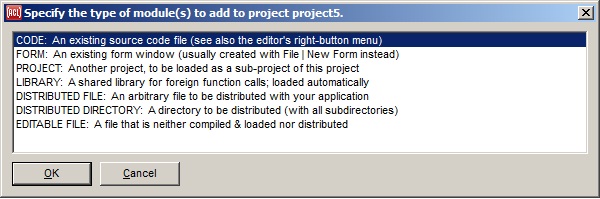
The file selection dialog is then shown, initially displaying only those files whose pathname-types match the requested module type. Specifically, .cl, .lsp, and .lisp files are shown for a source code module, .bil files are shown for a form module, .dll, .so, or .dylib files (depending on the platform) are shown for a shared library module, .lpr files are shown for a sub-project module, all files are shown for a distributed file module or editable file module, and directories are shown (in a different dialog) for a distributed directory module. Selecting a file of the appropriate type will add it to the current project and list it in the Project Manager. The next File | Save All that is done will then save the .lpr project definition file to include a reference to the new module.
Note that form modules are typically added by using the File | New Form command and then placing widgets onto the form interactively. But an existing form may still be added with the Add File button, perhaps a form that was removed from the project at an earlier time.
A quick alternative to using the Project Manager's Add button is to right-click an editor buffer pane and select "Add File to Project" from the pop-up menu that appears. If a source code file that you would like to add to the current project is already open in the editor workbook, this is faster than reselecting the file in the file dialog invoked by the Add button.
When a module is selected, clicking on the Remove Selection button (the one displaying a large X) removes the module from the project (if you confirm). The module's file is not deleted from the filesystem.
When a project is opened or loaded in the IDE or run as a standalone application, the modules are loaded in the top-to-bottom order shown in this list, after the project definition .lpr file itself is loaded. If the load order is important, the up and down arrow buttons on the Project Manager's toolbar may be used to shift modules around in the load order. The dialog constrains the order somewhat, however, and a warning dialog will indicate this fact if you try to move a module out of the area of the load order where it is allowed. Specifically, all shared libraries are always loaded first, followed by all sub-projects, followed by all form modules and source code modules combined. Distributed files, distributed directories, and editable files are not loaded at all, but are always listed last nevertheless.
Each item in the list shows the name of the module followed by the pathname of its file in parentheses. (A .cl file is shown for a form module, and implies the associated .bil and .bml files that have the same pathname-name.) If the file is in the same directory as the .lpr project definition file, this path is simply a pathname name and type, and otherwise it is a full (absolute) pathname --- this reflects the way the pathnames are stored internally, and therefore means that the project will still remember where all of its files live if the developer arbitrarily moves the directory containing the project definition file (or moves all of the project's files in that directory as a group) to a new parent directory or filesystem.
The name of each module depends on the module type. For source code modules, shared library modules, and distributed files, the module name is simply the pathname-name of the module's associated file (the source module util is named by its associated file util.cl, for example). For a form module, it is the name of the form window (which may not be the same as the name of the associated file, although in the illustration, all forms have the same names as their associated files). For a sub-project module, it is the name of that project.
If a sub-project module is added to the project, it will initially appear as a single line in the list of modules. Its icon will be a simple dark-blue triangle arrow pointing to the right. Unlike the icons for other types of modules, which are simply visual indicators, you can click on the arrow icon of a sub-project module to reveal all of its modules as an indented sublist. (Alternately, select the item for the module and press the right-arrow key, as usual with an outline widget.) Sub-projects can have their own sub-projects in turn, all of which can be shown in the module list as a tree. A project will remember which subtrees were currently visible when you last saved it, and restore the same visible part of the tree the next time you open the project.
The modules of a sub-project may then be accessed from the Project Manager and edited in the same way as modules of the current project itself. If you modify a sub-project, such as by changing the order of modules within a sub-project, the File | Save All command will know to regenerate the .lpr file of the subproject just as it does for the current project.
If you would like to open a sub-project as the current project, a quick way to do that is to right-click the item for the sub-project and select the Open Selected Project command from the pop-up menu that appears.
It may not be apparent how to rename various modules or to move their files to new locations, and in fact this depends on the type of module. To rename or move a source code module, select the module in the list and press the View Selected Code button to edit the source code file. Then (in the editor) use the File | Save As command to save the file to a different pathname. The Project Manager will automatically update to display the new pathname, and the next File | Save All that is done will save the .lpr project definition file so that it points to the new pathname of that module's file. To rename a form module, double-click the form to display it in the inspector, and then change the "name" property in the inspector. Again, the Project Manager will update to display the new module name, and the next Save All will update everything on disk. As with source code modules, the File | Save As command may be used while a form window is selected to save the form to a new pathname. To move a shared library or distributed-file module (or to rename its file), you need to move the file to a new pathname, then remove it from the project (or vice versa), and then add it back to the project at its new pathname (this technique could actually be used for any module type). To rename a sub-project module, you would need to open that project, change its name, and save it, and then re-open this project.
To change the name of the current project itself, use the Name widget on the Options tab. When the modal dialog that then appears asks whether to also rename the .lpr project definition file to match the new project name, then the .lpr file will be renamed if you answer Yes. (This dialog will not appear for a new project that has never yet been saved.) This is recommended to keep things simple, but is not necessary. The .lpr file could also be renamed in the OS file manager if the project is not open in the IDE at the time, though the Recent menu would then not find the project where it remembered it to be.
To move the entire project to a different directory, either move the directory itself or move all of the project's files that are in the directory to a new parent directory, then re-open the project from its new location.
Right-clicking in the list of modules shows a shortcut menu of commands that are generally the toolbar button commands. This menu also shows the keyboard shortcuts for the commands. Pressing the spacebar will also show this menu. Pressing the Enter key will invoke the Edit Source Code button, while double-clicking a module will invoke the Edit Dialog Form button (or else edit source code for a non-form module).
See the general description of the Project Manager dialog for more information on the toolbar buttons.
A tab of the Project Manager Dialog.
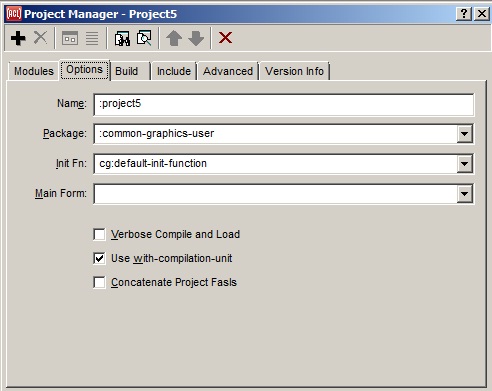
This tab on the Project Manager Dialog shows the values of several options to projects:
Name: A name for the entire project. This should be a symbol not naming any other project. This symbol is used to name the .exe, .dxl, and certain other files that are created by the File | Build Project Distribution and File | Build Project Executable commands. The name also appears in the title-bar of the IDE, and may be passed to find-project to find the project if it has been loaded with load-project or open-project. Using a keyword for the name is recommended. The project name could be retrieved or set programmatically by calling name or (setf name).
Package: Names the default package for source code that is auto-generated for the forms of the project. This value should be a keyword symbol that names a new or existing package, and this widget will coerce a value that is entered here to a keyword symbol. It is simplest to continue using the common-graphics-user package (the default), but another package may be used if desired. If the value entered does not name a package, a new package is created automatically with that name.
In any case, a basic defpackage form will be written into the generated .lpr project definition file for this project, to ensure that the package will always exist before it is needed. This defpackage form will use the cl, excl, and cg packages, and will export any symbols that are known to be exported from the package. You may add a more complete defpackage form elsewhere in the project code if needed; the package will then be augmented rather than replaced, as usual when there are multiple defpackage forms for a package. See project-package-name and form-package-name for more information.
Init Fn: The function that is run when the Run | Run Project command is invoked, or when the standalone application that is generated from the project is started up. The value must be a symbol naming a function that takes no arguments. The function should perform whatever initialization is needed, including creating any windows that should be displayed initially. If it returns a window, the application will run until that window is closed; otherwise the application will exit when the init function returns. The default init function simply creates the running window of the project's main form and returns it. See on-initialization, default-init-function, finder-function, and maker-function for more information.
Main Form: The form that is run by the default initialization function when the Run | Run Project command is invoked or the standalone application that is generated from the project is started up. This form is also indicated on the General tab by a special "moving window" icon. See main-form.
Verbose Compile and Load: whether *compile-verbose* and *load-verbose* are bound to true when the project is compiled and loaded. See verbose.
Use with-compilation-unit: whether the entire project is compiled inside a with-compilation-unit form, which avoids warnings about called functions that are defined in later modules, for example. See compilation-unit.
Concatenate Project Fasls: specifies whether compiling the project will produce a single fasl file that contains all of the project code (this will happen when checked). This single file could then be loaded into a development Lisp to use the application in that Lisp, without opening the project for further development. See concatenate-project-fasls. Note that you cannot have a source file with the same name as the project if you choose this option.
See the general description of the Project Manager dialog for details of the toolbar buttons.
A tab of the Project Manager Dialog.
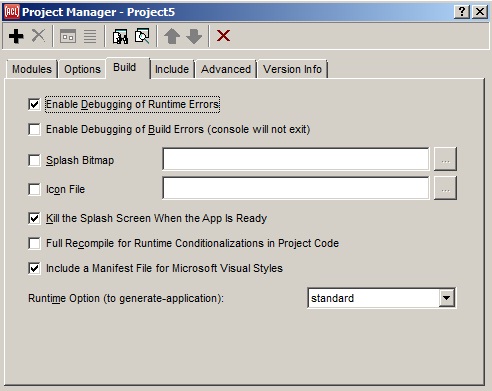
This tab on the Project Manager dialog shows several options associated with building the application associated with the project. (Build an application with File | Build Project Executable, which builds a test version for use on your machine; or File | Build Project Distribution, which creates a directory of all files needed for the application, suitable for sending to another machine. See also build-project, which is a programmatic equivalent of the two menu commands. Be sure you are properly licensed before distributing an application to another machine.)
The options are:
Enable Debugging of Runtime Errors: if this option is checked (as it is by default), then the console window is available in the standalone application to allow debugging until the application is ready to ship. Aborting from an error in the console will re-enter an event-handling loop, allowing the application to continue running. If *show-console-on-standalone-error* is true, as it is by default, then the console will also appear automatically when an error is signaled and not trapped by the application. The application's icon will also appear in the system tray, which may be double-clicked to expose the console window if it does not appear for some reason on an error, or to expose it when no error has occurred. (If a standalone application stops responding entirely, it is a good idea to double-click the tray icon to see if there is an error in the console.)
Note that it is the Franz Liszt icon that is displayed. The application icon specified by the Icon File option is not used in the system tray.
When this option is selected, the symbol :allow-runtime-debug will be included in the build-flags of the project.
We recommend leaving this option checked for debugging purposes until shortly before delivering an application, and then turning the option off for delivery, to shield the end user from the debugging console and tray icon as well as from the possibility of continuing to use the application after an unhandled error. When this option is turned off and an unhandled error is signaled in the delivered application, the project's default-error-handler-for-delivery function (see the Advanced tab) will be called, where the default function will show a simple dialog informing the user that an unhandled error has occurred and that the application will now exit. The lisp error string is included in the dialog, but the end user is not allowed to continue running the application in its broken state. To make a Common Graphics application handle errors more cleanly, an application should add its own signal handlers (such as calls to handler-bind) around code that could possibly signal an error.
Note that it is the Franz Liszt icon that is displayed. The application icon specified by the Icon File option is not used in the system tray.
Enable Debugging of Build Errors (console will not exit): if checked, the debugger will appear if an error occurs while generating the standalone application. This is implemented by passing the symbol :interactive as the build-debug keyword argument to generate-application. This allows debugging in the lisp that was generating the app, but also means that the console for that lisp will never exit, even when no build error occurs. Therefore, this option is not selected by default, and you would typically select it only if a build error has occurred, and then try again. When this option is selected, the symbol :allow-build-debug will be included in the build-flags of the project.
Splash Bitmap: the filename of a bitmap file which will be displayed while the application is starting up. See splash-file.
Icon File: the filename of an icon file (typically a .ico file) to be used for the application icon. If none is supplied, the Allegro CL icon (a bust of Franz Liszt) will be used. See icon-file.
Kill the Splash Screen When the App is Ready: Whether to remove the standalone app's initial banner window as soon as the main window has appeared, to avoid making the end user wait any longer. See kill-splash-screen-when-ready.
Full Recompile for Runtime Conditionalizations in Project Code. This option is needed only if the project source code contains #-runtime-system or #+runtime-system reader conditionalizations to make the project behave somewhat differently when it is run as a standalone application than when it is run in the IDE. See full-recompile-for-runtime-conditionalizations. If checked, all project code will be recompiled with :runtime-system included on the *features* list before a project distribution is produced, as described on the full-recompile-for-runtime-conditionalizations page.
Include a manifest File for Microsoft Visual Styles: if selected, the generated application for the project will have the newer "Visual Styles" look and feel on the Microsoft Windows platform. The illustration uses this new look and feel (it looks rather different from the illustrations of the other tabs of the Project Manager dialog). See include-manifest-file-for-visual-styles and also a-visual-style-is-active.
Runtime Option (to generate-application): generate-application must be called with a value specified for the runtime argument. The choices are :standard, :dynamic, and :partners (and these are the three values for this option). You must be licensed for whatever choice you make. See runtime.html for details. See also runtime-build-option.
See the general description of the Project Manager dialog for details of the toolbar buttons.
A tab of the Project Manager Dialog.
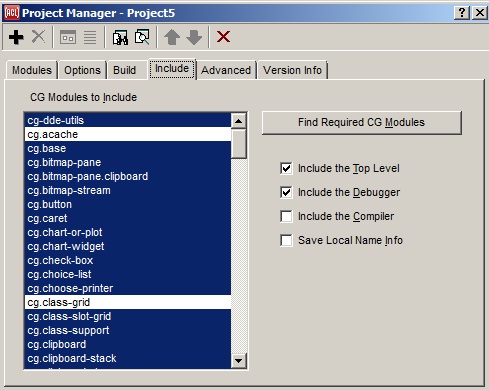
This tab specifies which set of optional CG modules (and which of a few base Lisp modules) are included in the standalone application that is generated from this project. At the left is an item-list that contains the names of all of the CG modules; these will all be selected initially in a new project. They can be individually turned on or off, but typically all you need to do is click the button to the right labeled Find Required CG Modules. This button will read the project's source code and determine which modules are used based on the home package of each exported CG symbol in the code.
In order for Common Graphics modules to be found correctly, the latest version of all project files must be saved. When you use the Find Required CG Modules button, if there are any modified project files then you will first be prompted to save them. The procedure will not continue if you leave files unsaved. If all files have been saved, all project source code will be searched. Then all CG modules that are found to be used, plus all of the modules that those modules depend on, will automatically be selected in the list of CG modules, and all other modules will be deselected. The .lpr project definition file is saved automatically at the end of the procedure with its new list of required modules.
If a project's source code modules load additional lisp files that are not themselves modules of the project, then the internally-loaded-files property may be used to cause the additional files to be searched.
The Find Required CG Modules button calls the function find-required-modules, which can alternately be called directly to search a set of source code files other than those of the current project.
In case it is not clear why some modules were required, a file called module-report.txt is written to the project's default directory, listing every symbol that was found for each module. But note that this file mentions only the modules that were explicitly used, and not the modules that were included because the explicitly-used modules required them.
There may still be cases where a project needs a particular module even though it did not use any symbols that are specific to it. In these cases, the build will fail, and will probably mention a package that was not found. You can then explicitly select the module whose name is the same as the package name, and try the build again. Note that selecting a module in the list will automatically select any other modules on which that module is dependent.
There also may be cases where the project manager believes that you may need a certain module that you do not actually use. You can try turning off this specific module, but "require" statements in other modules that you do need may load the module anyway.
The first three check-boxes in the lower right area of this tab indicate whether certain standard base lisp modules are included in the standalone app. The fourth check box determines whether local name information is saved (which allows for easier debugging). See include-flags. Here are the complete descriptions of the check boxes:
Include the Top-Level: if checked, the modules associated with the Lisp top level are loaded. Checking this is equivalent to specifying :include-tpl t to generate-application.
Include the Debugger: if checked, the modules associated with the Lisp debugger are loaded. Checking this is equivalent to specifying :include-debugger t to generate-application.
Include the Compiler: if checked, the modules associated with the Lisp compiler are loaded. Checking this is equivalent to specifying :include-compiler t to generate-application. You must have the proper Allegro CL license to include the compiler in an application (see runtime.html).
Save Local Name Info: if this option is not selected, then true is passed as the value of the discard-local-name-info keyword argument to generate-application. Otherwise nil is passed.
See the general description of the Project Manager dialog for details of the toolbar buttons.
A tab of the Project Manager Dialog.
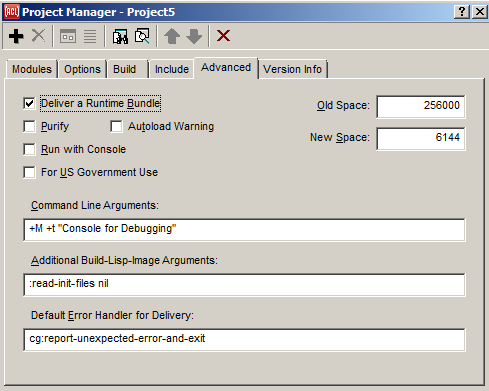
The Advanced Tab of the Project Manager dialog displays certain advanced options for the application associated with the project. The options and controls are:
Deliver a Runtime Bundle: Specifies whether the runtime-bundle argument to generate-application should be specified true (checked) or not (unchecked). When that argument is true, a runtime-suitable bundle file (containing modules permitted in a runtime image but not loaded into the image as built) will be included in the distribution directory. See Including all desired modules in delivery.html for more information. See also build-flags.
Purify: Specifies whether to move strings and code vectors that would otherwise be in the generated .dxl image file into a separate .pll library file, which is sharable by multiple lisp applications. (Checking this box is equivalent to specifying the purify argument to generate-application true.) See also build-flags.
Autoload warning: If checked, the autoload warning dialog will be displayed when a project build is complete. If unchecked, it will not be displayed. (Not displayed it facilitates batch processing.) See autoload-warning.
Run With Console: whether the standalone application should have a console window whose read-eval-print loop is always active. See run-with-console.
For US Government Use: check this if the application will be supplied to the US Government or someone working for the US Government (and the application is in connection with that person's work). If this box is checked, the copyright notice will include language that protects the rights of software vendors (the application developer and Franz Inc.) when supplying the US Government. That is the only effect of selecting this option. Note that it is not necessary to select this option when supplying a government of any country other than the United States or supplying a state or local government in the United States. See also build-flags.
Old Space: specifies the size of the initial oldspace in the application. The oldspace will grow automatically as needed but specifying a suitable value can improve garbage collection performance. See ge.html for more information on oldspace size and garbage collection. See old-space-size.
New Space: specifies the size of the initial newspace in the application. The newspace will grow automatically as needed but specifying a suitable value can improve garbage collection performance. See gc.html for more information on newspace size and garbage collection. See new-space-size.
Command Line Arguments: specifies default command line arguments (such as +c -foo) that will be passed to the generated executable automatically; see default-command-line-arguments.
As described below, a project will prepend either +cx or +c to these options internally, and so it is generally not necessary to specify a c option explicitly here.
The initial value for a new project includes the +M flag (to ensure that the standalone application fully exits when it attempts to exit with a non-zero exit code after an error), and also +t Console for Debugging (as a suggested title for the Console window, in case it were to be included with a delivered application). These flags are recommended for CG applications, though you may wish to add additional flags.
In addition to the command line arguments specified explicitly in this widget, either the +cx or +c flag will be added internally by the project system. If Enable Debugging of Runtime Errors is selected on the Build tab, then +cx will be added to include the console window in the application; it will be hidden but may be exposed for debugging. If Enable Debugging of Runtime Errors has been unselected (as you would typically do before delivering an application), then +c is passed to exclude the console window entirely from the application; this will also suppress the console's tray icon.
See Command line arguments and its subsections in startup.html for a table of standard command-line options.
Additional Build-Lisp-Image Arguments: specifies the values of any needed arguments to generate-application or build-lisp-image that are not covered by more specific project properties. The values entered here will form the plist that is the value of the additional-build-lisp-image-arguments property of the project. Text should be entered into this widget as this plist would print, except without the surrounding parentheses; for example:
:read-init-files nil :c-heap-size #x400000Default Error Handler for Delivery: specifies the value of the default-error-handler-for-delivery property of the current project. The value should be the name of a function that accepts a single argument, which will be a condition object. This function will be called in the standalone application for any otherwise unhandled errors if the Enable Debugging of Runtime Errors option has been disabled on the Build tab for final delivery. It is a good idea to include a package qualifier on the function name when entering it here, and the qualifier will continue to be displayed here in the future.
See the general description of the Project Manager dialog for details of the toolbar buttons.
A tab of the Project Manager Dialog.
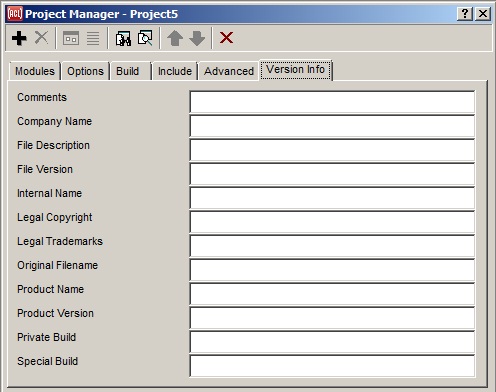
This tab on the Project Manager dialog allows entering version (and other) information about the standalone application for the project, which is used by the Windows operating system. The information is ignored on other platforms.
If an end user uses the Windows file manager to show the properties dialog for your application, for example, there will be a Version tab that lists this information. It is a good idea to always fill in some of these fields, because otherwise the Version tab in the file manager will contain only empty fields, though almost all applications supply information for some of the fields.
The information is stored as the value of the project-file-version-info property of the project, in the form of a property list. The File | Build Project Distribution command will pass the plist as the :file-version-info argument to generate-application, which will call the function win:set-file-version-info to modify the .exe file that has been placed into the distribution directory of the project. You could call win:set-file-version-info yourself on the project's .exe file, if desired.
A tab of the Project Manager Dialog.
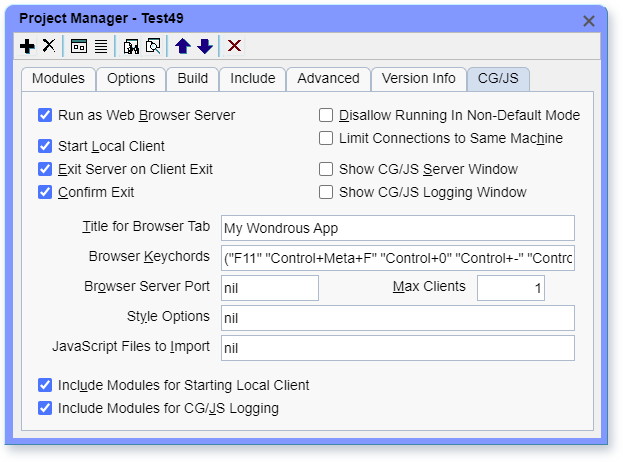
This tab on the Project Manager dialog specifies project options that pertain to running the application in a web browser (also known as CG/JS mode).
The first option on the upper left determines whether to run in web browser mode or desktop mode, and all of the other options apply only when running in a web browser. These options are used both with Run | Run Project and when running the generated application.
When running the generated app, the default values specified here can be overridden for a particular run with command line arguments. See Command Line Options When Running a CG App in a Web Browser.
The options are:
Run as Web Browser Server: Whether the generated application will run by default in a web browser or as a desktop application. When the IDE is running in desktop mode, Run | Run Project will also use this mode, though when the IDE is running in a web browser, a project cannot be run in desktop mode.
When running the project in a web browser, the app will appear in a new tab of the same browser. The command Run | Stop will do nothing, and you can instead simply close the browser tab for that run when you are done with it, and that will kill the process for that run.
The word "Server" in this option name alludes to the fact that the application always runs as a server when running in web browser mode, even when the Start Local Client option is used to start a client automatically.
The default value of this project option can be overridden with the --run-as-web-browser-server command line argument when starting up the generated application, unless the Disallow Running In Non-Default Mode option was enabled when generating the standalone application.
This option can be read or set programmatically with the run-as-web-browser-server accessor of the cgjs-options of the project.
The rest of the options apply only when running in a web browser.
Start Local Client: Whether running the generated application will also tell the default web browser on the same machine to connect to it as a client and display the application. Turning this option on causes the app to run like an ordinary standalone application that a user runs on their own machine.
Turning this option off causes the app to run as a server that one or more users can connect to at any time from their web browsers on the same machine or other machines, without installing any software on their own machine. This remote access could be within a local area network, or across the Internet if the server machine is open to the Internet.
If the app is run as a server (with this option off) and its Browser Server Port is 12345, then a user could connect to it by telling their web browser to visit localhost:12345 if the server and browser are on the same machine, or else with machine-name:12345, where machine-name is the name of the server machine.
The default value of this project option can be overridden with the --start-local-client command line argument when starting up the generated application.
This option can be read or set programmatically with the start-local-client accessor of the cgjs-options of the project.
Exit Server on Client Exit: Whether the application server will exit automatically whenever the last client has disconnected. This is typically used whenever Start Local Client is used, in the general mode to behave like an ordinary standalone application. When this option is on, the user can simply close the browser tab and be assured that everything exits.
Turning this option off allows the same user or different users to connect to the application server at different times as the server continues to run (or even at the same time if Max Clients is greater than one). This mode requires using some facility of the operating system (or else the Show CG/JS Server Window option) to kill the server eventually.
Note that when a user exits by closing the browser tab, that will bypass your app's official exit command and any cleanup that it does. So an app that runs in web browsers needs to follow the usual paradigm where you write a user-close method for your main window that does the same cleanup. Closing the browser tab directly will call user-close on each top-level window, allowing you to do cleanup in your user-close methods.
The default value of this project option can be overridden with the --exit-server-on-client-exit command line argument when starting up the generated application.
This option can be read or set programmatically with the exit-server-on-client-exit accessor of the cgjs-options of the project.
Confirm Exit: Whether the web browser will prompt the user for exit confirmation when they try to close the web browser tab for the application or reload the web page. Turning this on may avoid losing unsaved changes in the application.
The default value of this project option can be overridden with the --confirm-exit command line argument when starting up the generated application. While the app is running, it could call the setf of confirm-web-browser-exit to update the state that will be used in the rest of that session of the app.
This option can be read or set programmatically with the confirm-exit accessor of the cgjs-options of the project.
Disallow Running In Non-Default Mode: Whether an application that is built to run in web browser mode by default will be prevented from being run in desktop mode with a command line argument, or vice versa.
When this is enabled, running the standalone application will simply ignore any --run-as-web-browser-server or -b command line argument that was specified. So this option can be used if you intend to support only browser mode or only desktop mode, in case an end user were familiar with that command line option.
This option can be read or set programmatically with the disallow-running-in-non-default-mode accessor of the cgjs-options of the project.
Limit Connections to Same Machine: Whether a web browser will be able to connect to the CG application server only if it's running on the same machine as the server. This would prevent, for example, anyone from connecting from elsewhere on the Internet if the server machine is not behind a firewall.
This option can be read or set programmatically with the limit-connections-to-same-machine accessor of the cgjs-options of the project.
Show CG/JS Server Window: Whether an additional browser tab will appear for the CG application server, where you can exit the server by closing that tab or the window that's inside it. This tab will appear in a browser on the server machine. This is probably useful only for an administrator who is running the app as a server on one machine, allowing one or more users to connect to it from browsers on other machines. This avoids needing to use an operating system facility to kill the server when not using Exit Server on Client Exit.
The default value of this project option can be overridden with the --show-cgjs-server-window command line argument when starting up the generated application.
This option can be read or set programmatically with the show-cgjs-server-window accessor of the cgjs-options of the project.
Show CG/JS Logging Window: Whether the server window will have a child window that displays logging information, such as whenever a user connects or disconnects. This is probably useful only to an administrator when users are working on other machines, to know when there are active users. Show CG/JS Server Window must also be on when using this option.
The default value of this project option can be overridden with the --cgjs-logging command line argument when starting up the generated application.
This option can be read or set programmatically with the cgjs-logging accessor of the cgjs-options of the project.
Title for Browser Tab: The short string to display as the name of the application in the small browser tab above the application.
This option can be read or set programmatically with the title-for-browser-tab accessor of the cgjs-options of the project.
There is no project option for the "Loading ..." message that appears in the browser until the first window gets shown (to let the user know that something is happening), because that message appears before the browser has contacted lisp and before lisp has responded to the browser with information about the application. But you could edit that string constant in the copy of cgjs.html that gets distributed with an application.
Browser Keychords: The set of keystrokes that CG's JavaScript code will pass through to the web browser for its built-in behavior. This allows the user to use common web browser commands directly, because there appears to be no way to invoke them programmatically. This also means that the app cannot use these keystrokes for its own commands.
Here is the default value, where the second row is for when the app is run on a Mac and the first row is for when it is run on other platforms:
("F11" "Control+0" "Control+-" "Control+="
 "Control+Meta+F" "Meta+0" "Meta+-" "Meta+=")
The key names need to be JavaScript names, where Meta is the JavaScript name for the Mac's Command key. On a Mac, pressing the F key while holding down the Control and Command keys is the way to toggle full-screen mode, while F11 does that on other platforms. The other keystrokes allow the user to zoom the entire application.
Each keystroke should contain a main key name that's preceded by zero or more shift key names, with a plus character between names. The possible shift key names are Shift, Control, and Alt, plus Meta on the Mac (for the Command key). When the the main key is a letter key, it should be the uppercase character by itself (and not a lisp character object like #\A). For numeral and punctuation keys, it should be the unshifted character. Other special key names (which come from JavaScript) include Enter, Escape, Backspace, Tab, Home, End, PageUp, PageDown, ArrowLeft, ArrowUp, ArrowRight, ArrowDown, Insert, Delete, F1 through F12, Shift, Control, Alt, PrintScreen, and OS. (OS is for the Windows key on a Windows keyboard.) These names are all case-sensitive.
See also the variable *cgjs-client-options*.
This option can be read or set programmatically with the browser-keychords accessor of the cgjs-options of the project.
Browser Server Port: The port at which a web browser can connect to the CG application server. If this option is nil or zero, then the app will let the operating system select a port that is known to be free, and the port will be printed to the terminal where the app is being run when possible (probably not on Windows). If the Start Local Client option is "yes", then the browser will connect to this port automatically, and so you don't need to know the port number for entering it into a web browser.
When specifying a particular port, it should be between 1 and 65535, inclusive. If an attempt to use that port fails, then the operating system will be asked to select a free port, as when specifying zero.
The value can alternately specify a range of ports, as in 12800-12804. Then each port in the range will be tried until one is found that does not fail. This may be needed when a firewall allows only ports that are in that range. If the --launcher command line option is used, then the ports of all launched instances of the application will also be restricted to this range (and so the range should be at least as big as the Max Clients option).
Specifying a particular port may be somewhat risky because it would likely fail or lead to confusion if other software is already using that port. And specifying the same hard-coded port for multiple runs of the app could lead to confusion if a previous run did not actually exit for some reason, because then the browser will likely attempt to connect to the old server process instead of the new one. But you may need to use this option anyway when you are not starting a local client automatically and you're starting the app from a terminal that will not print an OS-selected port, because otherwise you would not know what port to tell a web browser to visit. Alternately, use the --port-file command line argument to place the OS-selected port into a file where you can retrieve it.
The port that gets used will become the value of *browser-server-port*.
The default value of this project option can be overridden with the --browser-server-port command line argument when starting up the generated application.
This option can be read or set programmatically with the browser-server-port accessor of the cgjs-options of the project.
Max Clients: The maximum number of clients that can connect to the running CG/JS server at the same time. This applies when running the app as a server and letting people connect to it from their web browsers. If someone tries to connect when this many clients are already connected, then their browser will show a message saying that the maximum number of clients are already connected.
If the number is greater than 1, then the application needs to be written in a way that works with multiple simultaneous clients. Each client will run in its own process to be independent of other clients, but it would still be a problem if the app stores data in global places like global variables when that data needs to be distinct for each client. The macro defvar-cg could be used to declare variables that automatically get a separate binding in each process; it otherwise works like defvar.
The default value of this project option can be overridden with the --max-clients command line argument when starting up the generated application.
This option can be read or set programmatically with the max-clients accessor of the cgjs-options of the project.
Style Options: Options for things such as the color and thickness of window borders, the font used in all menus, and the delay before showing a child menu. Stylistic properties like these are usually system-wide parameters that affect all apps in a windowing system. There is no equivalent in the web browser world, so CG/JS defines default values in the variable *cgjs-client-options*, which holds a large association list of them. See that variable for the complete alist.
This project property can contain any subset of the *cgjs-client-options* entries, except with different values to override the defaults. The custom values will be used in the standalone app that's generated from the project, and when running the project in the IDE.
The Project Manager widget for this is rather small, so if you want make significant changes you may want to do it programmatically, by using the style-options accessor of the cgjs-options of the project.
Here's an example that specifies bolder custom colors for window borders, with one color for the currently selected window and a second color for other windows.
(setf (ide:style-options (cg:cgjs-options (ide:current-project)))
  `((:selected-window-border-color
     ,(make-rgb :green #xaa :blue #xff))
    (:unselected-window-border-color
     ,(make-rgb :red #x77 :green #xcc :blue #xff))))
Your own CG application could similarly allow its users to specify some of these style options as well, and then write them to a file named foo-style-options.txt in the user's home directory (or the personal Documents directory on Windows), where foo is the name of the application's executable file. The content of the file should be an alist that contains some subset of *cgjs-client-options*, and then they will be used on subsequent runs of the app. The form (utilities-directory :hidden t) returns the directory where the file should be placed. See utilities-directory.
You can also customize these style options for the IDE itself (rather than for your application). See web-browser-style-options.
JavaScript Files to Import: A list of JavaScript code files that CG will automatically import at run time by calling import-javascript-file. This allows the application to call the file's exported JavaScript functions by calling the CG function call-js. Each element in the list should be a pathname or path namestring that is relative to the project folder, where you would typically place the JavaScript files. So you could place two files named one.js and two.js (for example) into the project folder and then set the value of this option to this:
("one.js" "two.js")The files will then automatically be imported when you run the project in the IDE. And when you generate the standalone application for the project, the JavaScript files will be copied to the distribution and imported when you run the generated app.
(You can alternately run a single form window in the IDE instead of the whole project, but that will not re-import the files each time. So to test changes that you're making to the JavaScript files during that IDE session you would need to run the project instead.)
This option can be read or set programmatically with the javascript-files-to-import accessor of the cgjs-options of the project.
Form windows are used to design application dialogs and windows. You can set attributes (background-color, dimensions, title, etc.) using the inspector of a form (see the Inspect dialog) and these attributes will apply to the window created from the form (some, such as dimensions and background-color, will apply to the form as well, but others, such as device, do not make sense applying to a form. (The class attribute of a form, accessed by device, tells the class of the window associated with the form. The class of the form itself is the form class.)
As you modify a form, code for creating a dialog with attributes specified by the form is automatically written and placed in the bil file associated with the current project. When the project is run, that code is used to create the window designed by the form.
The arrow keys can be used on form windows to move the selected control(s) by single pixels. In addition to allowing for more precise positioning generally, this is also a quick way to override the stickiness that affects dragging the controls.
Red lines are drawn to show when controls are in alignment. (When the Form | Show Alignment command is chosen, red lines are drawn connecting all aligned controls. When you move using the arrow keys, alignment lines are drawn for the moving controls only.)
If the control key is held down while the arrow keys are pressed, then the control(s) are resized rather than moved, with the right or bottom edges of the control moving in the direction indicated by the arrow key.
If the alt key is held down, then the control(s) are moved by ten pixels rather than by one or resized (when the control key is also held down) by ten pixels rather than by one.
Also, the tab key can now be used on form windows to move the selection to the next control in the tab order (and shift-tab moves to the previous control); this also highlights the alignment for the tabbed-to control.
And the main ENTER key will inspect the selected control and select the inspector window. This is mainly useful for unburying the inspector, since selecting a control on a form inspects it.
The TAB key will select successive widgets and inspect them (or select the first widget when no widget was selected). The Backspace key will unselect the selected widget if any, leaving the form itself selected. The spacebar will show the same shortcut menu that a right click shows.
See Chapter 6 of the IDE User Guide for information on forms. In the description, we provide some general information only.
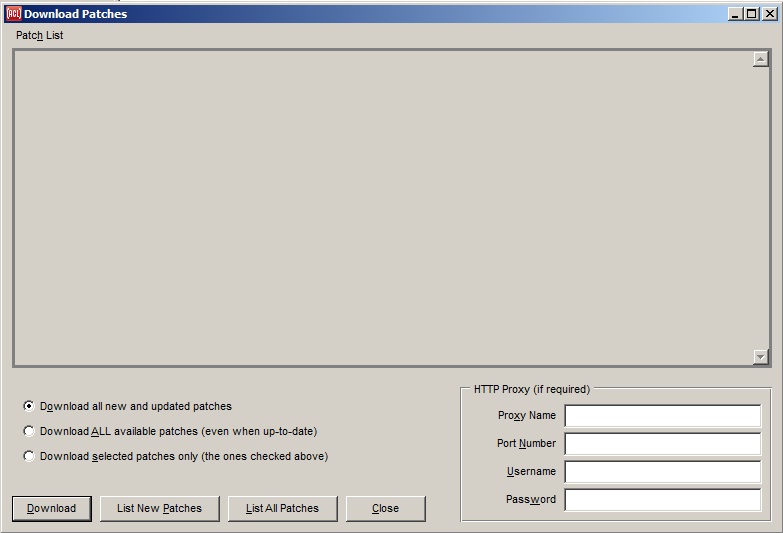
This dialog is displayed when you choose Install | Updates. It provides a window interface to update-allegro. In order for this dialog to work, the computer running Allegro CL must be able to make an FTP connection to the internet. (If your local network has a firewall, this dialog may not be usable to download patches. update-allegro has arguments, not settable with this dialog, that allow downloading to work in such situations.)
Displaying available patch information and downloading patches can take time. When you request those actions, a dialog reminds you of this fact and allows cancelling the request.
The display portion of the dialog displays (when commanded - it is blank when the dialog is first displayed) available patches, along with a checkbox to indicate whether or not the patch should be downloaded). The command buttons are (the radio buttons are described with the Download button):
Download: if clicked, the patch set indicated by the radio buttons above the button are downloaded onto your machine. The radio buttons specify whether just new and updated patches (determined by examining patches already downloaded), all patches, or just selected patches (selected with the checkboxes in the patch list) are downloaded when this button is clicked.
List New Patches: displays in the display portion of this dialog a list of all new (to you) and updated patches.
List All Patches: displays in the display portion of this dialog a list of all patches, whether or not new to you.
Close: close the dialog.
The four widgets in the HTTP Proxy group box at the lower right allow you to enter proxy information if your site requires an HTTP proxy. These widgets can be left empty if no proxy is needed, or just the proxy name and port number could be specified if no username or password is required. These values are saved as the value of the default-http-proxy configuration option so that future IDE sessions will remember the values, though the password is never saved for security reasons.
See also patch-reminder-interval.
The Debug window contains a lisp listener (with a prompt) where you can enter and evaluate Lisp forms. It also displays debugging information after an error (click here to see the description of the Debug window after an error). Here is the Debug window when there is no error being debugged:
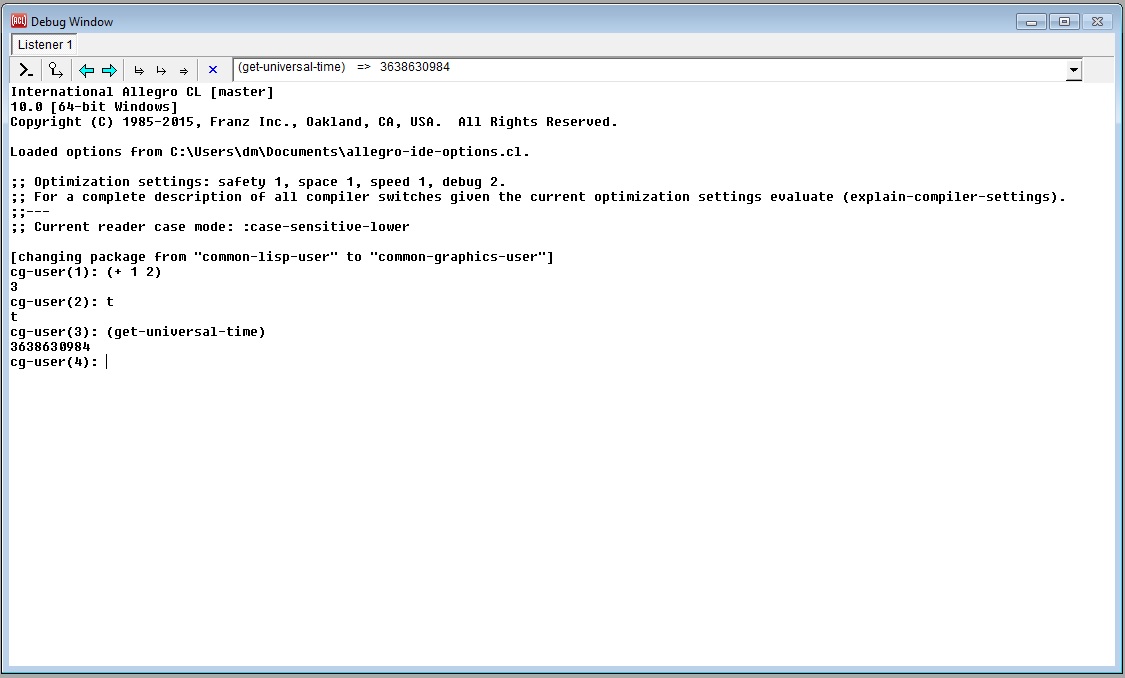
The prompt is a CURRENT-PACKAGE(Number):. You can type directly to the prompt, pressing Enter for a newline. If you have entered a complete Lisp expression, pressing Enter evaluates it and the returned value is printed below the entered form. If you have not entered a complete expression, pressing Enter places the cursor on the next line, suitably indented, waiting for more input.
There are various ways to repeat an already typed expression. One quick way is to place the text cursor anywhere within an expression visible in the listener pane and then press ENTER. This will copy the whole evaluated expression to the end of the listener's text (either to the prompt or after any text already entered at the prompt). You can quickly move the text cursor to various previously-evaluated forms by holding down the Control and Alt keys and pressing the up and down arrow keys (this also works without the Control key, though on Windows that can trigger functionality for inserting special characters that's built into Microsoft widget).
You can also use the history dropping outline to retrieve an already entered expression.
The dropping outline to the right under the title bar displays the history of entered Lisp expressions, with the most recent visible. (History can be cleared with the blue arrow icon just to the left of the History dropping outline.) Both expressions which were evaluated and those which were entered and not evaluated (because, e.g., the New Prompt button was clicked before evaluation) appear in the list. Clicking on an item in this drop-down list will paste the expression at the listener's prompt, ready to be evaluated again (after optionally editing it). Clicking the blue arrow at the left of an expression will show the values that were returned, each in a separate line (expressions not evaluated have a gray dot rather than a blue arrow); clicking one of these values will return the value, leaving the variable * bound to the value for further use. Expressions in the history drop-down list may also be manipulated more quickly with the keyboard shortcuts for some of the buttons to the left of the drop-down list; see below for details.
To instead copy a sub-expression of an earlier evaluation to the prompt, hold down the control key and left-click in or next to the expression. Clicking just before an opening parenthesis or just after the corresponding closing parenthesis will copy a list expression that starts or ends with that parenthesis; similarly, clicking just before an opening double-quote character or just after a closing double-quote character will copy a string; otherwise, clicking anywhere on a "word" (a character sequence demarcated by parentheses, spaces, tabs, and/or newlines) will copy that word (such as a symbol or number).
The buttons to the left of the dropping outline work as follows. (Placing the cursor over a button causes the tooltip to display. We identify the buttons by the tooltip description.)
New Prompt: click to get a new prompt. Any unprocessed input is discarded. In certain cases, the listener can become confused about input. Clicking this button clears that confusion.
Complete History Expression: if you start typing at the prompt and have matched the beginning of an expression in the history, clicking this button completes the expression. Thus, if you have earlier evaluated (+ 1.2 3.4), entering (+ 1.2 and pressing this button completes the expression to match the earlier input. If more than one expression matches what you type, the initial completion is to the most recent. If the most recent match is not the one you are looking for, then this button may be pressed multiple times successively to retrieve older matches. You are warned if nothing matches your input.
The arrows (Back in History and Forward in History): move forward or back in the history display. Typically you use these keys to select an earlier expression, and then use either the Paste button to copy the selected expression to the prompt for editing and re-evaluation, or the Paste and Evaluate button to re-evaluate the expression as is. The fastest way to reuse earlier expressions is to use the keyboard shortcuts for these buttons; the shortcuts are shown in the button tooltips.
Paste and Evaluate (a double line arrow with a tail): paste the current history expression (the visible one) to the prompt and evaluate it.
Paste (an arrow with a tail): paste the current history expression (the visible one) to the prompt but do not evaluate.
Evaluate (a double line arrow): evaluate the expression at the prompt (equivalent to pressing Enter). If the expression at the prompt is incomplete, go to the next line, indent appropriately, and wait for further input.
Clear History (a small blue X): clear everything from the history of evaluated Lisp forms and their returned values. This may be useful before calling get-objects or get-references to examine the heap, so that the garbage collector can first remove this old information from the heap. This command does not trigger a garbage collection itself, though, so you may want to use this button and then call gc before examining the heap. If you are using the inspector, then you may also want to right-click the inspector's background and use its Clear History command for the same reason. Using the Trace Dialog's Clear button may also free old objects if needed.
An additional listener pane can be created by choosing View | New Listener.
The Debug window displays debugging information when an error (more precisely, any unhandled condition that calls break) occurs in the IDE. Debugging in general is described in debugging.html. Please look at that document for detailed discussion of the information displayed by the debugger and debugging features. To produce the illustration, the unbound symbol a was entered to the Debug window prompt. Since a had no value, this Restarts dialog was displayed:
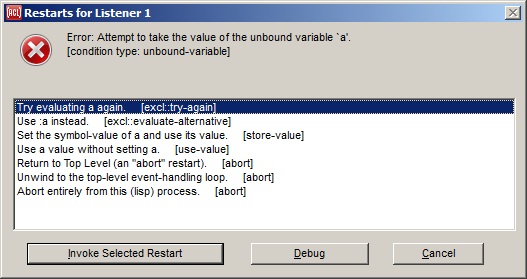
Clicking on Abort will cause the error to be unwound. Clicking on Debug changed the display of the Debug window to look like this, with the listener below and the debugging pane above: (click here to see the description of the listener in the Debug window):
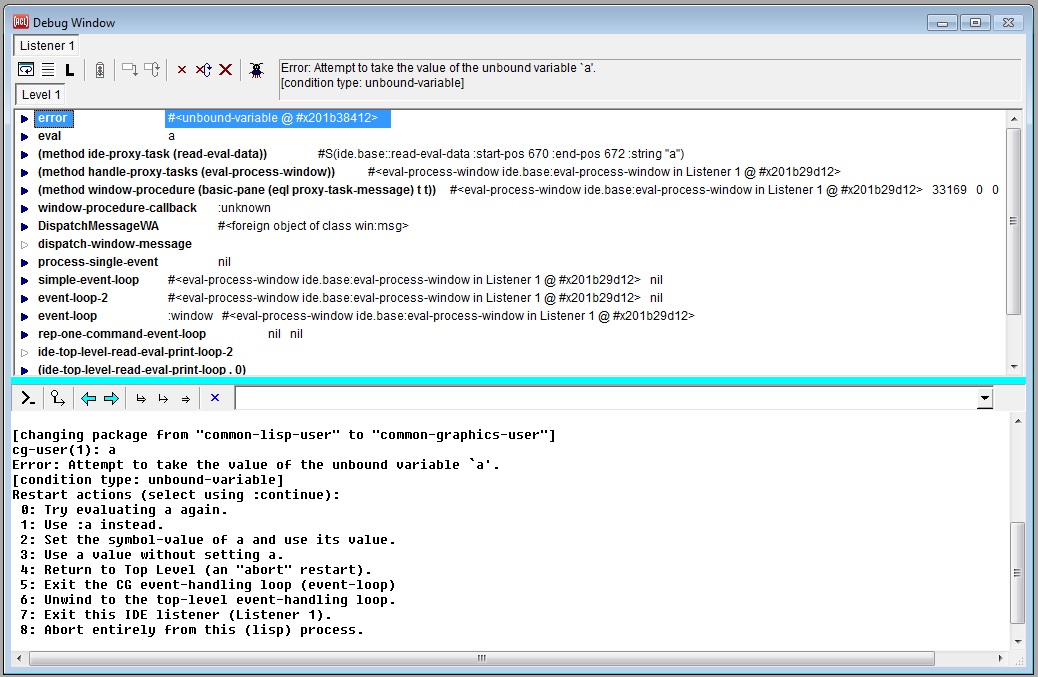
The debugging section at the top shows the error message in the text control to the right. (The message also appears in the listener portion but that is in part because that is where the error occurred). Below the toolbar, an outline control shows a stack backtrace (similar but not identical to what is printed in a listener in response to the :zoom command -- see the note The Debug Window after an error and the :zoom top-level command below). The buttons on the toolbar, identified by their tooltips, are as follows. Note that if a button is inappropriate for a situation, it is inactive and its tooltip will not be displayed.
Show Restarts: display the Restarts dialog. This is a modal dialog. Click Debug to return control to the Debug window.
Include Hidden Frames/Hide Hidden frames: switch between displaying and hiding hidden frames. See the :hide command for information on hidden frames. Hidden frames are typically internal calls which are not usually the cause of a problem. The tooltip says Include or Hide as the frames are not or are currently shown.
Include Local Variables / Hide Local Variables: switch between displaying and hiding local variables when opening the frame items for function calls to list the arguments that were passed. See the user option include-local-variables-in-backtraces.
Continue: if the error signaled is a continuable error (signaled by a call to error), this button is active and clicking it allows you to choose a continuation. However, most errors are not continuable (instead, they have restarts which is a generalization of the idea of continuable errors) so this button is usually inactive.
Return from Frame: Return (as with the command :return) from the selected frame.
Retry Frame: Restart (as with the command :restart) from the selected frame.
Pop This Error: clear one break level, as with the command :pop.
Pop and Retry: pop the error and re-evaluate the form that caused the error, as with the command :prt.
Abort This Process (icon is a big X): unwind all errors from the stack of this process, as with the command :reset.
Write a Bug Report (icon is a picture of a bug): writes a file containing the stack backtrace, along with dribble-bug and allegro-ide-options.cl information, which you can include in a bug report to support@franz.com. The
File | Save and File | Save As commands save dribble-bug and allegro-ide-options.cl along with the backtrace contents when the keyboard focus is in a backtrace pane. See About submitting a bug report from a break in the IDE in cgide.html.
If not all of the frames (function calls) that are on the stack are initially displayed, additional ones can be displayed by scrolling to the bottom of the backtrace, or by selecting the bottom-most displayed frame. The number of frames that are initially displayed (or added later) is controlled by the user option backtrace-frames-to-show.
If a backtrace should unexpectedly fail to appear when pressing the Debug button on the Restarts dialog, then see backtrace-safe-mode.
The outline (which is an instance of an outline widget) can be navigated quickly by pressing the J, K, F, and D keys as alternatives to the down, up, right, and left arrow keys respectively, and the T and B keys for the Home and End keys. This works because the outline widgets in IDE tool dialogs enable their handle-home-key-shortcuts property.
There are two ways to see the arguments and local variables of any function call (also called a frame) in the backtrace outline. One way is to "open" the outline item to see the arguments in place in the outline widget. Do this either by clicking the small blue arrow at the left of the outline item, or by selecting it and pressing the right arrow key (as usual with an outline control). It may be most handy to use the up and down arrow keys to peruse the stack, then pressing the right arrow key to see the arguments of a function call, and then pressing the left arrow key to close that item before proceeding to another one (to get the previous list of arguments out of the way).
The other way to view the arguments and local variables is to show them in the inspector. This can be done either by double-clicking the outline item for the desired function call (to the right of the blue arrow), by selecting the "Inspect Arguments and Variables" command from the right-button menu of the outline-item, or by invoking the Tools menu | Inspect Selected Object command while the desired outline-item is selected.
A combination of these two techniques may be used by opening an outline-item and then double-clicking one of the arguments (or using Tools menu | Inspect Selected Object) to inspect an individual argument value.
When viewing arguments and local variables directly in the outline control, the icon at the left of each value indicates what type of argument or value it is. Each icon is actually three letters, where "Req" indicates a required argument, "Key" a keyword argument, "Opt" an optional argument, "Res" a rest argument, "Aux" an aux argument, and "Loc" indicates a local variable value. The icons are in different colors to help distinguish them.
Each argument and variable value is printed according to the IDE options dialog-print-level, dialog-print-length, dialog-print-array, and dialog-print-circle, which can be set on the IDE 2 tab of the Options. If the printed representation doesn't fit in the single line that's provided for it, you can see the full text (or much more of it) in a large tooltip window by holding the mouse cursor over the value. Even if the value does fit as printed, a tooltip will still appear if a longer representation will be printed by extending the printer variables *print-level*, *print-length*, and *print-array*. Specifically, the tooltip will use a *print-level*that's one greater than dialog-print-level, a *print-length* that's triple the value of dialog-print-length, and with *print-array* always true. The necessary hovering time for the tooltip to appear is controlled by the CG option tooltip-delay, which can be set on the Common Graphics tab of the Options.
For debugging experiments, it can be useful to change the value of an argument or local variable when execution is paused at a break, and then to continue execution with the modified values. In the IDE's backtrace pane, there are two ways to modify an argument or local variable: one way is to view all of the arguments and variables of a stack frame in the inspector as described above, and then to modify one or more values as usual in the inspector. The other way is to open the outline item for a stack frame, then right-click one of the arguments or variables for that frame and select the Modify Argument or Variable command. A modal dialog will then appear, into which you can enter a Lisp expression that will be evaluated to produce the replacement value.
Once you have modified one or more arguments or variables for a particular frame, you can continue execution in one of two ways. If you modified an argument (rather than a variable), then you can press the Pop and Retry button in the backtrace pane's toolbar to retry the call to that frame's function with the replaced argument(s). Or if execution is paused at a continuable error, then you can modify either an argument or a local variable, and then press the Continue button in the toolbar to continue execution from the actual point of the error. (It's not useful to modify local variables for a non-continuable error.)
The Inspect Function Object (or Inspect Method Object) command on the right-button menu of a backtrace outline-item will inspect the function or method itself, rather than its arguments and local variables. Unlike the other commands on this right-button menu, this one is not a shortcut for any IDE menu-bar command, and so this particular action may be invoked only from the right-button menu.
Though the IDE implements this specialized graphical interface for browsing a backtrace and proceeding from an error, the corresponding top-level commands such as :zoom are still always available in the listener pane. If both techniques are used simultaneously, note that the two views of the stack are independent, with each one maintaining its own currently selected stack frame, and each one independently either currently showing hidden frames or not. (The IDE display depends on the Include Hidden Frames/Hide Hidden frames button, the :zoom display depends on whether :zoom is called with :all t or :all nil.) In addition, the IDE backtrace outline always shows the whole stack (adding new clumps of frames as you scroll to the bottom), while the :zoom command shows a certain number of frames according to its (sticky) count argument.
The Editor Workbook is a dialog showing one or more editor buffers. Each buffer may be open to a file, or may contain text data not yet saved to a file. Display the Editor Workbook with View | Editor. Open a new buffer with File | New. Open an existing text file with File | Open. Save with File | Save (you are prompted for a filename if the buffer is not already associated with a file). Close with File | Clode Pane when the buffer to be closed is selected. Most of the commands on the IDE menu-bar are applicable in the editor, typically acting on the symbol or other "word" that the text cursor is on. The Edit menu is especially directed at the editor.
When saving a new IDE editor buffer for the first time, a yes-or-no dialog will first ask whether you want to add the new file to the current project. (This dialog will not appear if there is no current project, or for a form's editor buffer since that is already in the project.) If you answer yes, then the Save File dialog will default to the project's default directory, and the file will be added to the project. If you answer no, then the Save File dialog will default as it otherwise would, which is generally to the directory in which a file was last selected in this dialog, and the file will not be added to the current project.
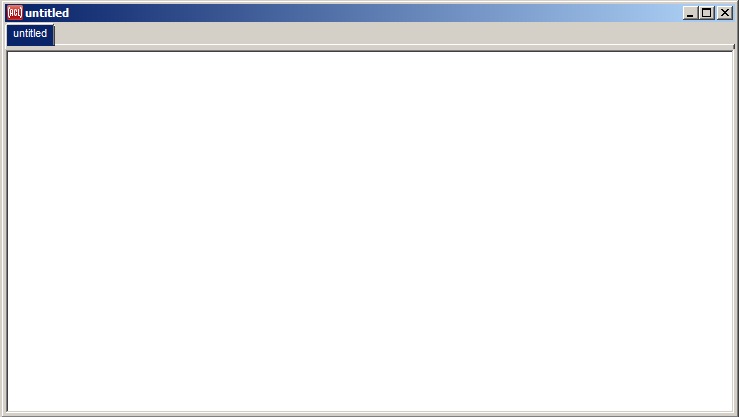
Here is the Editor Workbook when Allegro CL and the IDE starts up, with one untitled buffer named Untitled. (If the Editor Workbook is not visible, it can be displayed with the View | Editor command.)
Editing in an editor buffer is mostly standard (type what you want and characters appear at the cursor, selecting text and typing deletes the selection, replacing it with what is typed, etc.) The behavior of key chords (a modifier key, like Control or Alt pressed with one or more character keys) depends on the current Comtab, which is specified on the Editor tab of the Options. The predefined comtabs are Host, Emacs, and Brief. Clicking Help | Shortcut Keys displays a Shortcut Keys dialog showing the key combinations, the function called by the key combination, and whether the source of each keyboard shortcut is the IDE menu-bar, a global keyboard shortcut, or the current editor comtab. See *text-edit-comtab* to find out how to add your own key bindings to the IDE editor's comtab (command table).
For a handy mouse click shortcut for copying or moving forms in the editor, see use-mouse-clicks-to-copy-lisp-forms.
Two commands that are used frequently in the IDE Editor are the Tools | Incremental Compile command and the Tools | Incremental Evaluation command. The word "incremental" in these names means that you can compile or evaluate individual definitions or other expressions each time you modify your code incrementally.
The keyboard shortcuts for these commands (when the editor is in Host mode) are Control-D and Control-E. So typically each time you have just modified a defun form or other definition, you can quickly recompile that individual definition by first making sure that the text cursor is somewhere inside the definition, then typing Control-D to compile it, and then perhaps retesting the code.
If there are compiler warnings, then a list of them will appear in a modal dialog. That dialog has a button that lets you show a definition that has a warning in the editor (where there could be multiple such definitions if you had first selected the code for all of them, or when using Compile and Load). That feature is fancier if the code was compiled with optimization switches that enable source-level debugging, where editing a definition that has a warning will then select the expression inside the definition that triggered the warning. And a quick way to enable source-level debugging is to have the stepper-dialog present when you compile the code. There's a similar feature when an error occurs at run time, where one of the restarts in the Restarts dialog allows you to show the erroring function in the editor, similarly selecting the erroring expression when source-level debugging is in effect.
If instead you want to evaluate a top-level form, then you would type Control-E instead. The values returned by the evaluation will then be printed to the listener in the Debug Window. If you are evaluating particular forms frequently, then evaluating them in the editor (and saving them to a file) may be handier than re-entering them in the Debug Window or finding them in the Debug Window's command history.
When no text is selected, these commands are applied to the top-level form that the text cursor is currently inside or after. (A top-level form is simply one that begins with an open parenthesis in the leftmost column of the editor buffer.) Specifically, the command will be applied to a top-level form if the text cursor is either immediately before its opening parenthesis, or somewhere inside the form, or after the form but before the position immediately before the next top-level form (if any).
When any text is selected, these commands are applied directly to the selected text rather than to a top-level form. This is generally more useful for evaluation than for compilation. Text can be selected as usual by dragging the mouse with the left button down. In addition, a handy way to select a lisp form is to double-click immediately before the form's opening parenthesis. If multiple expressions are selected, then each one is compiled or evaluated in succession. You can even use the Edit | Select All command (control-A) to select all text and then compile or evaluate the entire editor buffer.
Another way to evaluate an expression in the editor is to place the text cursor just before the expression and then press the Enter key on the numeric keypad. (Or hold down the Alt key and press the main Enter key.) In addition to evaluating the expression, this also moves the text cursor just past the expression; this allows you to evaluate a sequence of expressions by pressing the numeric keypad's Enter key repeatedly. It is OK to repeat this keystroke quickly, because each successive evaluation will not be done until the previous one has returned. If the Control key is held down while pressing the numeric keypad's Enter key, or both Control and Alt are held down while pressing the main Enter key, then the form to be evaluated will first be copied to the listener as if it had been entered there at the prompt; this provides more context for reviewing the output in the listener.
The Tab key in all Comtab modes indents the current line appropriately for displaying Lisp text. Thus, if you have entered
(defun foo (x)pressing Enter moves the cursor to the next line, adding spaces so the character typed is just under the e in defun. If you place the cursor at the beginning of the second line and press Tab, the cursor moves so the next character will be under the e in defun but no Tab character is input (instead, spaces are input as required). If you want an actual Tab character, press Shift-Tab.
If there is either an in-package form (such as (in-package :cg-user)) as the first top-level form in a buffer, the package in the buffer will be the specified package as soon as Find Package Specifier is chosen from the Editor's Shortcut Menu (described below on this page) or any of the menubar commands File | Save, Tools | Incremental Compile, or Tools | Incremental Evaluation are chosen.
The package of the buffer affects symbol completion and whether symbols need to be package-qualified in order for the system to identify them (for purposes of listing arguments of functions, finding documentation pages, etc.)
Shortcut menus that appear when right-clicking in IDE windows. They generally offer commands that are already available on the IDE's menu-bar, but are considered particularly useful in the context where the shortcut menu was invoked (Cut and Paste are on the Editor's shortcut menu, for example, as well as on the Edit menu). However, the Editor's shortcut menu also contains a few useful commands that are not found elsewhere. the command are appropriate for the type of file being edited. Not all these commands appear on the menu for all files.
Add File to Project: adds the source code file shown in the currently selected editor pane to the current project. If you happen to be editing this file already, then this command is easier than using the Add button on the Project Manager dialog, which would require you to re-specify the file pathname using the file selection dialog. (This command will not appear if you are editing a new editor buffer that has not yet been saved to a file, or when there is no current project.)
Find Package Specifier: detects the (in-package ...) form in the selected editor pane and sets the current package of the pane to be that package, so that the symbols in source code will be read into the correct package.
Select Most Recent: this command exposes the editor buffer most recently exposed before the current one. Its shortcut is Control+Shift+J. This choice is on the menu in part to remind you of the keyboard shortcut.
Select Next Most Recent: this command exposes the editor buffer next most recently exposed before the current one. Its shortcut is Control+Shift+K. This choice is on the menu in part to remind you of the keyboard shortcut.
Select Third Most Recent: this command exposes the editor buffer third most recently exposed before the current one. Its shortcut is Control+Shift+L. This choice is on the menu in part to remind you of the keyboard shortcut.
Select Tab On Left: this command exposes the editor buffer just to the left of the current one. Its shortcut is Control+Shift+,. This choice is on the menu in part to remind you of the keyboard shortcut.
Select Tab On Right: this command exposes the editor buffer just to the right of the current one. Its shortcut is Control+Shift+.. This choice is on the menu in part to remind you of the keyboard shortcut.
The last four commands are not particularly useful for selecting from the shortcut menu itself, since it would be easier simply to click on the desired editor pane's tab instead. They appear on the menu as a reminder of their handy keystroke equivalents. For example, pressing control-shift-comma in the editor (perhaps more easily remembered as control-left-angle-bracket) selects the editor pane to the immediate left of the currently selected pane; and pressing control-shift-J selects the most recently selected pane. All such keyboard shortcuts may be found on the Shortcut Keys dialog displayed by choosing Help | Shortcut Keys.
These commands are handy for selecting various editor panes without needing to take a hand off the keyboard while typing. They are related to the Show Second, Show Third, and Show Fourth commands on the View | Manage Windows submenu, though those menu-bar commands apply to top-level IDE windows while these shortcut menu commands apply to panes within a single top-level window. These commands are also available in the Debug Window.
When the IDE configuration option highlight-selected-editor-tab is true, the IDE editor will always highlight the tab of the currently-selected buffer. This option is initially true, as the otherwise visual indication of the currently selected tab is rather subtle.
This dialog is displayed by the Form | Set Tab Order menu command, when a form is selected. It lists all the controls on a form according to their tab-position and allows, using the arrow buttons, reordering the tab-positions. Alternately you can simply click and drag control names to new positions in the list, which may be faster.
Pressing the Sort Vertically button will sort the controls so that they are ordered by the vertical position of the top of each control, with the control nearest the top of the dialog being first in the tab order. It may be most convenient to start with that order, and then to further adjust the order of individual controls as needed.
The tab order of the controls is also the front-to-back occlusion order. This does not matter in the typical case where controls do not overlap, except that group-box and tab-control widgets need to be behind the controls that are on them. When designing dialogs interactively using form windows, this constraint is enforced automatically, but you may notice that group-boxes and tab-controls have mysteriously moved toward the bottom of the list in this dialog.
This dialog is displayed by the Form | Add Component menu command, when a form is selected. The dialog allows adding a component to the form. A component is a control or a non-visible object with programmatic effect. (Controls are always visible.) Only controls are supported at this time, so this dialog allows adding controls to a form.
Selecting a control and clicking OK places an instance of that control on the form.
This dialog is displayed by the Search | Complete Symbol menu command when the list of possible completions is too long to fit on a simpler control. Here we have entered "p" and chosen Search | Complete Symbol. There are many symbols starting with p. Choosing Search | Complete Symbol when "page-" is entered displays this simpler dialog without a title.
When a new project is created, by, for example, the File | New Project menu command, this dialog is displayed to allow choosing the default project directory. The chosen directory is displayed on the Modules tab of the Project Manager dialog.
There is a default parent directory for Allegro projects, shown as the parent in the illustration (it is C:\allegro-projects). This directory is chosen by the Project Parent Directory dialog. That dialog appears the first time a new project is created.
Projects have associated directories, the default location for files associated with the project. This directory is indicated on the Modules tab of the Project Manager dialog. When a new project is created, the New Project Directory dialog is displayed.
There is a default parent directory for project directories. That default is chosen by this dialog, which is displayed the first time a new project is created. The directory specified that first time is used as the default when new projects are created later. The default location is C:\allegro-projects, as shown in the illustration.
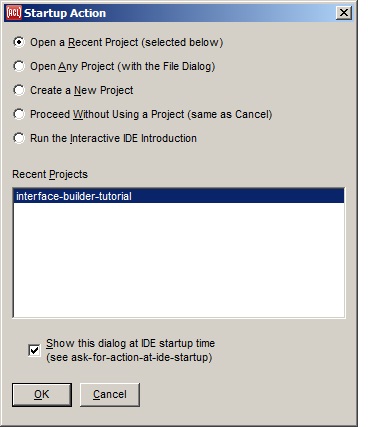
This dialog will appear at IDE startup when there are recent projects to reopen. If there are no recent projects, this dialog does not appear. (It also does not appear in the Allegro CL Express Edition). The dialog asks whether to open one of the recent projects, and also has other choices, such as whether to create a new project. The choices are presented as radio-buttons:
Tools | Save Options Now command or the Tools | Save Options on Exit command.) The list of recently-used projects are listed further below on the dialog, with the most recently used project selected at the top of the list. To open the most recently used project for further development, simply click OK or press the Enter key. To open another recently-used project, select it and press OK, or double-click it. (This can also be done later by using the Recent | Open Project command.)
File | Open Project command.)
done later by using the File | New Project command.)
Proceed Without Using a Project: This option runs the IDE with no current project. This is also done if you simply cancel the startup dialog by pressing the Escape key or clicking the Cancel button. When there is no current project, warning dialogs may appear if you try to use certain project functionality such as showing the Project Manager dialog, creating a new form, or clicking the Components toolbar. And a few things may behave differently; for example, when saving an editor buffer for the first time, you will not be prompted about whether to add the new file to the current project, since there is no current project.
Run the Interactive IDE Introduction This option starts up a high-level introduction to the variety of development tools that are available in the IDE. (No project is created or opened.) The
introduction may also be run with the Help | Interactive IDE Intro menu command at any time.
Tools | Options by using the check-box labeled Ask for Action at IDE Startup, or by calling (setf ask-for-action-at-ide-startup). When this dialog is disabled, the IDE never opens or creates a project at startup time, though you can open or create a project any time later.
This dialog is never shown if the IDE is started up with a -project command line option for an initial project to open. Instead, that project is always opened, regardless of the value of ask-for-action-at-ide-startup. (This happens when you double-click a .lpr project definition file in the operating system's file manager.)
Various IDE windows may or may not appear when creating or opening a project. For more information, see these IDE configuration options:
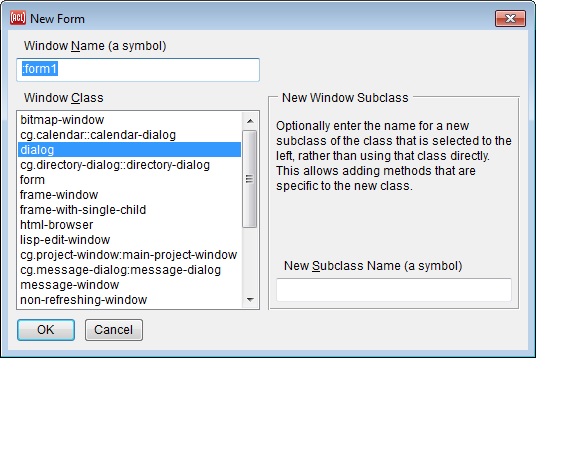
This dialog is displayed by the File | New Form menu command. It creates a new form window for interactively laying out the widgets of an application window. A name for the new application window may be specified here (see name), along with the window class that will be instantiated for it (see device).
A form window must be part of a project. If there is no current project, then the New Form command will instruct you to first use the File | New Project command or the File | Open Project command.
The first widget on the New Form dialog is for the name of the new application window. This is a symbol by which the window may be found with functions such as find-window and find-application-window. A keyword is recommended to avoid package considerations. This name will also be the suggested filename for the form when you save the form for the first time.
The name is also used to name the finder-function and maker-function that are automatically generated for creating the form's window. For example, if the form name is my-main-window, then a finder-function named my-main-window and a maker-function named make-my-main-window will be generated, and may be called by your application code to find and/or make the window.
So it is a good idea to initially assign a useful name for the new form, though you can also use the inspector to change the name property of the form at any time. The finder-function and maker-function will then be named according to the new form name the next time the form is saved.
The other two widgets on the New Form dialog are for the class to instantiate to create the application window. The list widget at the left includes a set of built-in instantiable window classes, plus any subclasses of these classes that you have already defined. The class that is selected here will be the class of the application window if no new subclass name is entered in the widget to the right, and otherwise will be the direct superclass of the new subclass that is created.
A symbol to name a new subclass for this application window may optionally be entered into the widget at the lower right. If a name is entered, then a defclass form is automatically generated and evaluated to define a subclass with this name, with the class selected from the list to the left as a direct superclass. It may be desirable to define a subclass for each application window, so that methods that are specific to it may be written.
When the new form is created, a form window will appear, allowing you to place widgets onto it from the Components Toolbar. An inspector will also appear for a new form if no inspector was already present. To place a widget onto a form, just click a button in the Components Toolbar for the desired type of widget, and then click in the form window to place it there. Left-click a widget on the form to edit its properties in the Inspector (double-clicking also exposes the Inspector).
Creating a new form will also create a new editor buffer into which you can write source code related to this application window. If you have requested a new subclass for the window, then the generated defclass expression for the new class will be written into this editor buffer, and you can modify it anytime later to add slots and so on. Additional source code will be generated into this buffer if you use the inspector to create event-handler starter functions for widgets on the form; this is done while inspecting a widget by clicking on the small button beside an event-handler property on the Events tab of the Inspector.
You can save a form by using the File | Save command whenever either the form window itself or its associated editor buffer is selected. This saves the editor buffer for the form (if present) to its .cl file, and also generates a file with the same name except for a file type of .bil; this generated file contains code for creating the application window with the widgets that you have laid out interactively (see maker-function).
User-written code associated with a form does not have to be placed into the suggested .cl file, but doing so helps keep the code organization tidy. In particular, a form's .cl file is loaded just before its .bil file, and having the defclass expression for a form in the .cl file ensures that it is loaded before it is used by the .bil file.
The Processes dialog displays information about the processes within Lisp. See multiprocessing.html for information on processes. It is displayed with the View | Processes menu item.
Click on the Update button to update the display. It is not updated automatically.
Name: The name of the process
Brk: The break level of the process. A process enters a higher break level when an error is signaled but not handled. Other conditions, when signaled, may put a process in a break level under certain circumstances (when *break-on-signals* is true, e.g.) Break level 0 means no unhandled error or condition.
State: The state of the process (active, runnable, waiting, etc.)
Status Note: The "whostate" of the process (as returned by process-whostate). While the value can be any string, it usually describes what the process is doing.
Prio: The priority of the process.
Quantum (Q... in the illustration): The process quantum.
Time: the (approximate) total cpu time consumed by the process.
Delta: The cpu time consumed since the last report.
Dis: The number of times the process has been resumed since the last report.
Analyzable (A... in the illustration) A * in the column indicates the process can be included in a runtime analysis (see runtime-analyzer.html.
Arrest Reasons the arrest reasons (as returned by process-arrest-reasons) of the process.
See also the top-level command :processes.
The Trace Dialog provides a graphical display of all calls to traced functions and methods that occur while the dialog is present. This includes functions that are traced by calling trace or using the :trace top-level command as well as functions that are traced by selecting the function name in any IDE dialog and invoking the Run | Trace command.
If the Trace Dialog is present, then all trace output in Common Graphics and IDE processes will go to the Trace Dialog and will not be printed elsewhere. Otherwise all trace output is printed as usual in the listener for each process. The Trace Dialog is "present" if it has been shown with the Run | Trace Dialog command and it has not subsequently been hidden by clicking its close button or using the File | Close Window command. (It is still present if it has been iconized or is covered by other windows.)
The large Trace History outline at the left shows the hierarchical relationship of the function calls, where a child item represents a call that was made while inside the call represented by its parent item. The call is identified by an index number and the function name. Next to the function name is the number of milliseconds that were spent in the call. After that is a phrase like "after 7 ms". That means that the call was entered 7 milliseconds after the most recent entrance to or exit from a traced function. These notes may help determine what is taking more time than expected.
Selecting a call in the Trace History outline displays more detailed information about that call in the dialog's other widgets.
The outline (which is an instance of an outline widget) can be navigated quickly by pressing the J, K, F, and D keys as alternatives to the down, up, right, and left arrow keys respectively, and the T and B keys for the Home and End keys. This works because the outline widgets in IDE tool dialogs enable their handle-home-key-shortcuts property.
The Arguments and Values Returned widgets at the right show the arguments that were passed to, and the values returned from, the selected function call. (If the values were thrown rather than returned, then the widget label will say "Values Thrown to
Pressing the Toggle View button shows an alternate view that replaces the Arguments and Values widgets with two others. (Pressing this button repeatedly toggles between the two views.) The Effective Method widget shows the individual methods that may have been called for a selected generic function call (given the particular arguments that were passed), along with their calling order and relationship. Each method is represented here only by its qualifiers and specializers to save space, since the generic function name is highlighted in the Trace History to the left. Double-clicking an individual method (or using Search | Quick Find Definition) will invoke the editor on that method's souce code directly if its location is known. Using the Run | Trace command on a method in this widget will trace the individual method rather than its generic function. This widget will show information only for a traced generic function, and not for a traced regular function or a traced individual method.
The Stack widget (also in the alternate view shown by the Toggle View button) lists the names of functions that were found on the function call stack at the time of the selected call. The most recent calling function is at the top of the list. The Depth widget lets you specify how many stack frames to search for calling functions; a lower value may decrease the amount of time taken up by tracing. The Stack widget can be useful when you can't remember the name of a function that you would like to trace --- you can instead trace a lower-level function that you know that the desired function calls, and then look in the stack widget at the callers to that function; if you see the desired function in the stack widget, you can select it and use Run | Trace to trace it, and then run your test again with the desired function traced.
The Clear button will clear all accumulated information from the trace dialog, making it easier to find subsequent trace information at the top of the Trace History.
Checking the Scroll While Tracing check-box will turn on the scroll-while-tracing configuration option. This option continuously scrolls traced function calls into view as they occur, allowing you to see when each call happens. On the other hand, this can slow things down or cause the Trace History to scroll to the bottom when you are looking at an earlier call. The Scroll to Bottom button may be used instead to quickly scroll to the most recent trace information only when desired.
You can resize some of the widgets in the Trace dialog by using the invisible split-bar widgets that lie between them. Just move the mouse cursor into the vertical gap between the two columns of widgets, or into the horizontal gap between the widgets in the righthand column, until the mouse cursor becomes a resizing cursor. Then click and drag.
Traced calls that occur in multiple threads are combined into the single outline widget of the Trace Dialog, but hierarchies of traced calls in multiple threads are never interleaved in the outline. Specifically, the tree of calls that appear under a single top-level item in the trace outline are always calls that occurred in the same thread as that top-level item; any traced calls that occurred in other threads during the call represented by that top-level item will appear under further distinct top-level items of the trace outline. The numbers at the left of each outline item, on the other hand, indicate the global order in which the individual calls occurred; so the numbers will not be in numerical order from top to bottom if hierarchies of traced calls in multiple threads overlap in time. The title of the Trace Dialog indicates the thread in which the currently selected call occurred. (Tracing in the event handling code for a specific window can be suppressed. See inhibit-trace-for-object.)
Double-clicking an item in the Trace History outline will invoke the Search | Quick Find Definition command on the selected function call. This overrides the usual outline functionality of toggling the selected item open or closed, but that can still be done by single-clicking the item's arrow icon or by using the left and right arrow keys. Several other commands from the IDE menu-bar of likely interest are on the right-button pop-up menu. Pressing the Enter key when any of the non-button widgets on the Trace dialog has the keyboard focus does the same thing as double-clicking the selected value there.
When either Search | Find Definition or Search | Quick Find Definition is invoked on a call to a generic function in the Trace History outline, the methods that are presented as choices will include only the methods that are applicable to the arguments that were passed in that function call, sorted with the most applicable methods first (as determined by compute-applicable-methods. To instead choose from all methods of the generic function, invoke Search | Find Definition and then turn on the "All" check-box on the Definitions dialog.
See trace-format for a way to write arbitrary debugging output to the Trace Dialog. See process-trace-color and with-trace-color for information on modifying the background color on a per-process basis. The configuration option scroll-while-tracing allows you to view new trace output as it is being collected. To direct trace output from non-CG/IDE processes to the Trace dialog, call use-trace-dialog-in-this-process.
The File | Save command is implemented for the trace dialog to save all the trace info (except the stack and effective method for each call) as an indented text file.
This dialog is displayed with the Run | Runtime Analyzer Control Dialog command.
This dialog has buttons for starting, suspending, and stopping the collection of runtime analyzer data, and also has controls for specifying the type of data to be collected. Runtime analyzer data are useful for determining which functions in your application are using a lot of time or are using a lot of memory to create lisp objects. See runtime-analyzer.html for a full description of the runtime analyzer in Allegro CL.
The radio-buttons at the upper left indicate the basic type of runtime analysis data to be collected, depending on whether you are interested in what code is taking most of the time (a CPU Time or Real Time analysis), what code is doing most of the consing of new objects (a Space analysis), or which functions are getting called frequently (Call Counts analysis).
The Interpret Closures check-box indicates whether separate nodes will be created in the analysis statistics for closures (when checked, they will, when unchecked, they will not).
The controls at the upper right determine whether function calls are counted, what particular functions should definitely be counted, and the maximum number of functions that will be counted. Once you have checked that call counts are to be included, you may then enter function names into the Functions to Count text widget (one per line is suggested, though you need only include spaces between function names) and/or enter how many functions should be counted.
This item-list on the right allows you to exclude particular processes from the analysis. Just single-click the names of any processes that are not of interest, and dark highlighting will indicate that they are being excluded. Single-click them again to return them to the processes being analyzed. If not all of the current processes are shown in the list, invoking the Run | Runtime Analyzer Control Dialog command again will refresh the list to reflect all current processes. You may want to exclude the IDE GUI thread, for example, since code running there is usually running the IDE itself rather than the application that you are developing in the IDE.
The Granularity widget on the right below the Select Processes to Exclude item list sets the value of the variable *granularity*, which specifies the number of clock ticks between each sample that is taken. It must be a positive integer, and the dialog will reject other values.
The Max Samples widget below the Granularity widget sets the value of the variable *maxsamples*, which specifies the maximum number of samples that will be collected. It must be a positive integer, and the dialog will reject other values.
When you click the Start Sampling button, start-profiler is called to begin collecting data, passing arguments that correspond to the information that you have specified in the various other controls on the dialog.
While sampling is occurring, you may press either the Suspend button or the Stop button. The Suspend button discontinues sampling temporarily (allowing you to add more samples to the same dataset a bit later; see stop-sampling). Note that the same parameters (granularity, maximum samples, type) are used when you resume sampling as when sampling started: it is not possible to change parameters while suspended. The Stop button ends data collection and prepares things for analysis (see stop-profiler).
You may also stop while suspended. While in the suspended state, the title of the Start Sampling button changes to say Resume, and will call start-sampling (rather than start-profiler) to continue sampling using the parameters that were in place when the analysis was first started.
The Show Results button may be pressed after data collection has been stopped. It displays the Runtime Analyzer Results dialog and (programmatically) presses its Update button (if it is available) to display the results of the new analysis in that dialog.
Note that the Start / Resume, Suspend, and Stop buttons have global keyboard accelerators so that you may start and stop an analysis, for example, while a Run | Run Project application window is selected. This lets you avoid switching to or from the IDE while sampling may be occurring. The global keyboard shortcuts are shown in the IDE status-bar when the mouse cursor is held over the buttons, and are also shown in the Run | Runtime Analyzer Control submenu of the Run menu on the IDE menu-bar.
Also, when sampling is started from the Start Sampling command in the Run | Runtime Analyzer Control submenu, the parameters that are currently selected in the Runtime Analyzer Control Dialog (if it has been invoked in this IDE session) are still used. This is true even if the dialog has been "closed", since the IDE actually just hides this dialog when a close gesture is made on it.
The static-text control at the lower left indicates the current state of the runtime analyzer, as returned by profiler-status. When the state is Sampling, it is shown in red to help you avoid collecting a huge sample by inadvertently remaining in this state for a long time.
This dialog displays runtime analysis statistics. A runtime analysis is a collection of data about which functions were being called and where most of the time was being spent or where the most memory was being used by the creation of new lisp objects. (See runtime-analyzer.html.)
The Runtime Analysis Results dialog has several displays: the Outline display (the top picture above), the Flat display (the second picture above), and the Calls display (not illustrated). There is also a Graph display, which appears in a separate dialog when the Graph button at the bottom is clicked. A Graph example is shown below.
To start collecting data, either invoke the Run | Runtime Analyzer Control command or display the Runtime Analyzer Control dialog (by invoking the Run | Runtime Analyzer Control command) and press its Start Sampling button. When you feel enough data has been collected, stop data collection either with Run | Runtime Analyzer Control | Stop Sampling command or the Stop button on the Runtime Analyzer Control dialog. Now you are ready to analyze the data using this dialog. (Alternately, you can call stop-profiler, stop-profiler, and related commands programmatically, and then display the results on this dialog.)
When the dialog is first displayed by the Run | Runtime Analyzer Results Dialog command, no information is displayed, and so you need to press the Update button to analyze the current analysis data and display it here. Similarly, if a subsequent analysis is performed, invoking this dialog with the Run | Runtime Analyzer Results Dialog command will continue to show the currently-analyzed data until you again press the Update button to analyze the newer data. (On the other hand, pressing the Show Results button on the Runtime Analyzer Control dialog will automatically update this dialog to show the new data.)
The three tabs summarize the collected data in up to three ways. Illustrated above is the Outline presentation (onthe Outline tab), which corresponds to the output from show-call-graph, and the Flat presentation (on the Flat tab), which corresponds to the output from show-flat-profile.
The third tab is the Call Counts presentation, which corresponds to the output from show-call-counts (not illustrated).
(Data was collected from defining and running the factorial function, excluding most IDE-related calls. One usually collects data when running your application or parts of your application. See runtime-analyzer.html for discussion of how to use the runtime analyzer. Here we are only interested in the dialogs and how they display.)
Nodes in the outline presentation indicate functions or methods called, as do the entries in the left column of the Flat and Call Counts displays. The Flat and Call Counts presentations may be sorted differently by clicking on the column headers. And (as usual in the IDE dialogs), the Search | Find Forward or Search | Find Backward command may be used to search for arbitrary strings in any of the presentations.
The outline (which is an instance of an outline widget) can be navigated quickly by pressing the J, K, F, and D keys as alternatives to the down, up, right, and left arrow keys respectively, and the T and B keys for the Home and End keys. This works because the outline widgets in IDE tool dialogs enable their handle-home-key-shortcuts property.
Clicking the Graph button presents the information from the Outline presentation as a tree graph. The blue bars on the left side of the graph nodes indicate the portion of the time spent (or space consed) in the node's branch as a fraction of the time spent in the parent node's branch. If the blue bar is as tall as the node itself, that indicates that 100% of the time in the parent branch was spent in this branch; a blue bar half as tall as the node indicates that 50% of the parent branch was spent in this branch. If there is a green bar, that indicates the portion of the entire analysis time that was spent in this node's branch. The yellow bar on the right side of a node indicates the portion of that node's branch that was spent within that node itself, as opposed to its sub-nodes; in other words, the portion of hits that occurred within that function itself rather than in the functions that it called. The yellow bars are not drawn on the leaf nodes since they would always be the full node height on those nodes.
The appearance of nodes on the Windows platform can be controlled with the configuration options use-color-gradients-in-tree-graphs and use-antialiased-text-in-tree-graphs.
Similarly, the blue bars are not drawn on "only child" nodes, since they would also always be the full node height.
Press this button to display a dialog showing various types of nodes to exclude from the outline or graph. This can be useful to prune a huge number of nodes down to a more manageable set. Press the Update button after modifying the filter to update the display to reflect the new filter.
Press this button to allow re-viewing this analysis after further analyses have been performed (within this IDE session). You will be asked to enter a name for the analysis, which will be added to the combo-box list at the top of the dialog. Selecting the name from this combo-box at some later time will once again display that analysis in the dialog.
Press this button to save the contents of the currently displayed analysis to a plain text file. (The File | Save command does this as well when this dialog is selected.) It sometimes may be useful to send this generated file to Franz with a bug report.
The file will contain only the lines are currently visible in the outline widget, so you may want to open the outline further to reveal any lines that look interesting before saving to file. (As usual with a Common Graphics outline control, you can Control-click on the open/close icon of an outline-item to open all of its descendents, or type control-rightarrow.)
The right-button menu in the Outline view or in a graph contains special analysis commands, rather than the usual selection of commands from the menu-bar as in most IDE dialogs.
When a number appears after a method or function name, either in the outline view or a analysis graph, it is the number of times that that method or function was called. These numbers will be shown only when call counts were included in the analysis, and only for the particular methods or functions that were counted). If the method or function appears in more than one branch of the analysis, the number is for the whole analysis rather than for that particular branch.
When the text in a node of an analysis graph is dark blue rather than black, it indicates that there are additional nodes in the graph for that method or function, where it was called in other places. The commands "Print Statistics" and "Graph Combined Subtree" on the right-button menu may be particularly useful on these nodes, because they provide combined information on all of the branches that begin with that method or function.
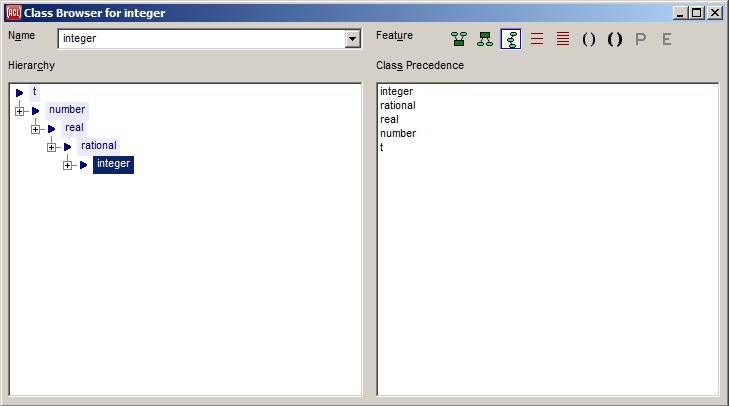
The class browser displays a graphical outline of the class structure (focusing on the specific named class). Information about the selected class is shown in the pane on the right.
The outline (which is an instance of an outline widget) can be navigated quickly by pressing the J, K, F, and D keys as alternatives to the down, up, right, and left arrow keys respectively, and the T and B keys for the Home and End keys. This works because the outline widgets in IDE tool dialogs enable their handle-home-key-shortcuts property.
The browser is displayed when Tools | Browse Class is clicked. If there is a selected symbol naming a class (or if the cursor is in or next to text naming a symbol naming a class), that class is selected in the browser. Otherwise, the previously selected class or t are browsed but you can enter a class name in the Name field to browse a different class. In the illustration, we are browsing the class integer.
When a class outline is generated for a class, that class is initially selected in the outline (as integer is in the illustration), but you can then click on other classes in the outline (or use the arrow keys as usual) to display information about related classes. When this is done, the class for which the outline was generated will be highlighted in the outline with a light blue background, while the selected class in the outline (for which information is displayed in the pane) will always be highlighted with the usual selection background color that you have set up in the Windows Control Panel.
Pressing the main ENTER key while the outline widget has the keyboard focus will generate a new class outline for the class that is currently selected there, just as if the Tools | Browse Class command had been invoked on that class name. Right-clicking the outline will pop-up a shortcut menu of several commands from the IDE menu-bar that are likely useful for the selected class (this right-click does not select a class though), and other IDE menu-bar commands may be applicable as well.
The information displayed in the pane on the right depends on which of the Feature toolbar icons is slected. Positioning the mouse over an icon will display a tooltip naming the icon (we use those names in the description below). The first seven refer to any class and the last two (P and E for Properties and Events) apply to Common Graphics-related classes.
The first three choices list classes that are related to the selected class. Double-clicking or pressing ENTER on one of these classes will generate a new class outline for that class.
The next two choices list slots of the selected class. Double-clicking or pressing ENTER on one of these slots will inspect the slot definition object. Simply selecting a slot will cause any classes that are visible in the class outline and which define a slot with that name to be highlighted with a light red background; this feature can be used to find out where an inherited slot is inherited from, and the Search | Quick Find Definition command can then be used to edit the code that defines the slot. (The single selected class in the outline will always have its usual highlighting, and so will not show this special red highlighting.)
The next two choices list methods of the selected class. Double-clicking or pressing ENTER on one of these methods invokes the IDE editor on that method (if the location of its source code is known). Invoking the Run | Trace command will trace just the selected method, rather than its generic function. Invoking the Edit | Delete command will offer to remove the selected method from your lisp environment.
The final two choices display the properties of the selected class. In the illustration, we the combo-box class is selected and its properties are listed.
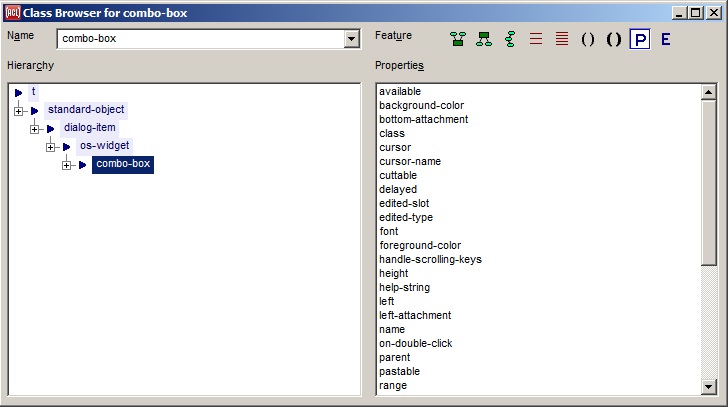
These choices are enabled appear only if properties have been defined for the class by calling defproperties or defcomponent (only certain CG and IDE classes initially). Double-clicking or pressing ENTER on one of these properties will inspect the property; this may be useful for finding the names of the property-reader or property-writer functions for the property in the rare cases where these are not equal to the property name itself (and its setf).
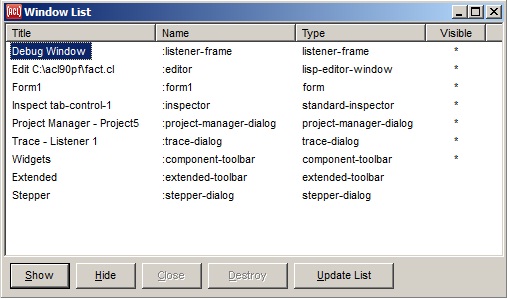
Displays a list of all top-level windows, displaying the title, programmatic name, type (i.e. class) and whether it is visible or not. (Closed windows that may be reused are in fact not destroyed but stored in an invisible state so they can be quickly redisplayed.)
The windows are listed initially visible first by title, then not visible by title. Clicking on a column label (Title, Name, Type, and Visible) causes the display to be ordered alphabetically by that column.
The Windows List dialog has the following buttons:
:shrunk).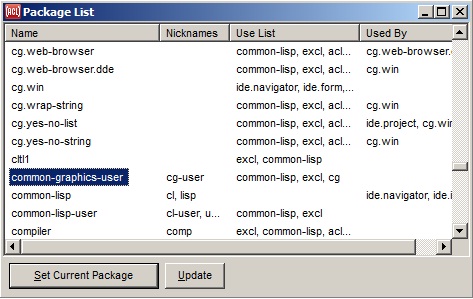
This dialog lists all packages currently defined in the running Lisp. Nicknames, Use List (i.e. the list returned by package-use-list applied to the package) and Used-by Lists are also displayed. The display is not updated automatically. To see changes since the last update, click on the Update button. The current package in the IDE Listener Thread (the value of *package* in the Debug Window) is selected when the dialog is displayed.
The value of *package* can be set in the thread of the IDE Listener that's currently selected in any of these ways:
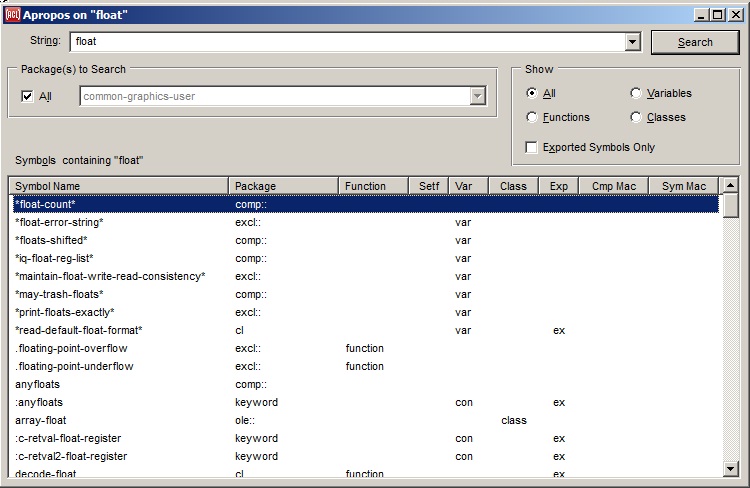
The Apropos dialog, displayed by clicking Search | Apropos, is a search engine for finding symbols in the running Lisp whose names contain the contiguous characters specified in the String field. Exactly those characters, contiguous and in the specified order must appear in the symbol name. Case only matters when the case mode is sensitive or if a symbol has a mixed case name (which is unusual).
The search can be constrained to just symbols exported from their home package, to just symbols naming functions (actually operators -- functions, generic functions, and macros, that is symbols for which fboundp returns true), to just naming variables (symbols for which boundp returns true), or to just symbols naming classes. The search can also be constrained to symbols accessible in a single specific package, as in the illustration, where only symbols accessible in the top-level package are shown..
Enter the string (without quotation marks) to be searched for. There are no wildcards. Only symbols whose name contains the exact characters entered in this field, in order and contiguous are displayed. (Thus, in the illustration, only symbols containing "float" are displayed. A symbol named flomat, if there was one, would not appear.)
When you have entered the desired string, click Search or press Enter to display the results. A drop-down list shows previous strings. Changing a string does not update the results display until Search is clicked or Enter is pressed.
A warning dialog appears if no symbols fit the search criteria.
When the String field is empty, all symbols that fit the other criteria would be included. Displaying so much in a dialog is problematic, and thus doing so is not supported. If you click Search when there is nothing in the String field, a dialog is displayed saying Enter a search string before doing an apropos search. No search is done when no characters are in the String field.
There can also be very many symbols that contain a single specified character. Searching on a single letter is supported but a warning dialog is displayed before the search is done to allow you to confirm your intention. Such a search, if performed, can take an appreciable amount of time.
If checked, only symbols exported from their home package are displayed. In the illustration, this box is not checked and so cg.grid-widget::section-size-float (not exported from the cg.grid-widget package) is shown. Unexported symbols are identified by double colons following the package nickname and by no mark in the Exp column (exported symbols have a mark in the Exp column).
The display is updated immediately if you check or uncheck this checkbox.
Symbols in all packages are shown if the All checkbox is checked. If it is unchecked, as in the illustration, only symbols accessible in the package named in the drop-down list are shown. All symbols whose home package is the package to search are displayed. Other accessible symbols are those exported from a package used by the package to search. Thus, symbols in the common-lisp (nickname cl) package appear whenever the package to search uses the common-lisp package (and most do). There is no way to restrict the search to symbols whose home package is the package to search. There is also no way to restrict the search to more than one package. All or one are the only choices.
The display is not updated automatically if you change from All to a single package or change the single package. Click on the Search button to update the display.
If All is selected, all symbols fitting other criteria (contain string, accessible in package) are displayed. If Functions is selected, just those symbols naming functions (or generic functions or macros) are displayed. If Variables is selected just those symbols that have a value are displayed. If Class, just those naming a class. Changing the Show field causes the display to be updated immediately. Note that a single symbol can name a function, a variable and a class.
The results of a search are displayed in the List View control labeled "Symbols containing [string]". The symbol name appears on the left, then the nickname of the home package, then whether the symbol names a function, whether that function is setf'able, whether the symbol names a variable, whether it names a class, and whether it is exported from its home package, whether it names a compiler macro, and whether it names a symbol macro.
The Function column will display "generic" for a generic function, "function" for a nongeneric function, "macro" for a macro, "special operator" for a special operator, or "functor" for a Prolog functor. The Var column will display "var" for a global variable or "con" for a constant. The Class column will display "class" for a standard-class, "struct" for a structure-class, "nonstd" for certain non-standard classes, or "type" for a type that does not name a class (such as bignum). Other columns will display only a single particular string indicator or nothing, such as "setf" in the Setf column, where the particular string simply makes it unnecessary to look up at the column header for the meaning of the indicator.
Double clicking on a symbol name (or selecting it and pressing enter) displays a Find Definition dialog allowing you to find the source code of the definition of the symbol if that code is available.
At any time, clicking on the Search button updates the display.
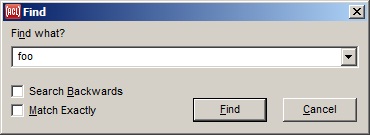
This dialog, displayed by Search | Find Forward or Search | Find Backward, allows searching for text in a window or widget of some sort (the search will be done in the selected window).
This is a modal dialog and it will disappear after use. Search | Find Again can be used to find the same string again.
The field holding the string to look for is a combo box with previously searched for items stored.
Searching will be backwards (up in a Window) if Search Backwards is checked. Case of letters is ignored unless Match Exactly is checked.
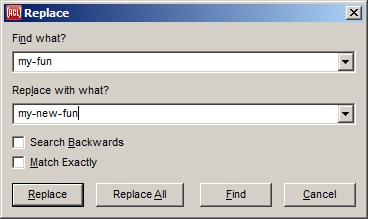
This dialog, displayed by Replace on the Search menu, allows searching for and replacing one string with another in a text window of some sort (the search will be done in the selected window).
This is a modal dialog and it will disappear after use. Search | Replace Again (which typically has a keyboard shortcut) can be used to find and replace again.
Searching will be backwards (up in a Window) if Search Backwards is checked. Case of letters is ignored unless Match Exactly is checked.
The fields holding the string to look for and the string to replace are combo boxes with previously chosen items stored.
If the Find button is clicked, the searched for string will be found but not replaced (replace it with Search | Replace. If Replace All is clicked, all occurrences between the current location and the end of the Window (bottom for normal searching, top for backwards searching) will be replaced.
This dialog, displayed by Clipboard on the View menu, displays the Allegro Clipboard. Items are placed on it as strings (as the most recently placed item is also placed on the Windows clipboard).
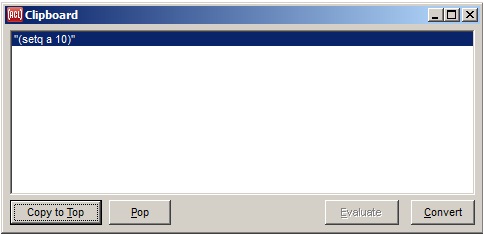
Convert converts the selected object to a Lisp object. Evaluate (only available when a converted item is selected) evaluates the item and returns the result to standard-output (and sets * to that value). Copy to Top copies the selected item to the top (and places it on the Windows clipboard). Pop deletes the top (not the selected) item.
See cg-clipboard.html.
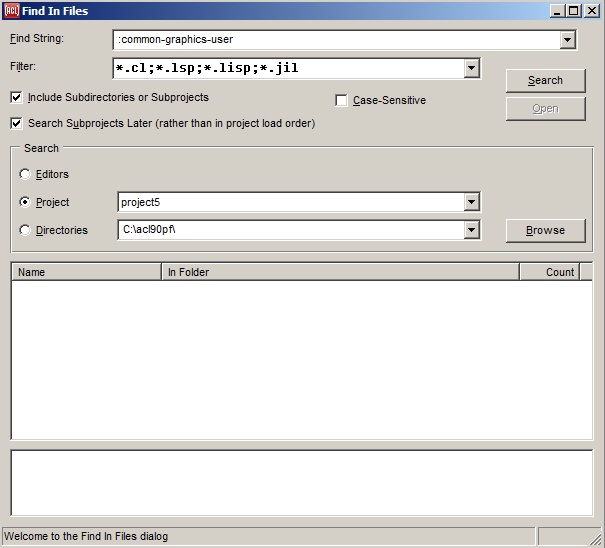
This dialog searches files, editor buffers, or project files for the string specified in the Find String field.
Enter the string (without quotation marks) to be searched for. Once you have entered the string, click on Search or press Enter to start the search.
This field has an effect when searching a directory or a project, but not when searching editor buffers. Only files matching the specification (in the illustration, files with type cl, lsp, lisp, or jil) are searched. The filter may contain multiple filters separated by semicolons, for example .cl;.lsp;*.lisp;jil, as in the illustration. The filters are kept in a history list. The filter wildcard may also be directly appended to the search directory, as in c:\allegro-projects*.cl.
Clicking on Search, equivalent to pressing Enter in the Find String field, initiates or updates the search.
Clicking on Open when a file or editor buffer listed in the results field is selected opens that file or displays the buffer.
When checked when searching files, all files in all subdirectories of the specified directory are searched. If unchecked, only the files in the specified directory are searched.
When checked while searching a project, the entire project hierarchy is searched. When unchecked, only the top-level project is searched.
When checked, letter characters in the searched files and/or editor buffers are considered to match only when they are the same string case as in the search string. When unchecked, either case will match.
When checked, searching a project will search subprojects only after searching all files in the top-level project. That can help find matches more quickly in the main project, which is likely of more interest. When unchecked, all files are searched in the same order in which they are loaded (where subprojects are loaded first). That can help determine when things are not defined in the best order, such as using a defparameter before defining it.
The value of this check box will be remembered across Lisp sessions as the user option find-in-files-search-subprojects-later, assuming options are saved.
The search can be in editor buffers, in a project loaded into the running Lisp (whether the current project or not), or in files in the specified directory, as the appropriate radio button is selected. Use the Browse button to choose a directory using standard Windows tools.
When the Find In Files dialog is first used in an IDE session, it will initially be set to search the current project if there is an open project at the time, and otherwise to search a directory.
Also when opening a project, the default directory for the file selection dialog is now set to the path of the project. Note that this default is still overridden when using the file selection dialog in the IDE editor (where it defaults to the directory of the selected editor buffer) unless the context-sensitive-default-path configuration property is turned off.
Files or buffers in which the string appears are listed here. The folder containing a file is shown along with the number of occurrences in the file or buffer. If you select a file or buffer and open it by clicking the Open button or pressing Enter (or equivalently double-clicking the file or buffer name), the first instance of the string is highlighted in the editor, and clicking Search | Find Again finds the next occurrence.
When a file that is opened from the Find In Files dialog has a file type of htm, html, or shtml, then the file is displayed in an HTML browser program rather than in the IDE editor.
Either invoke-html-browser or invoke-private-html-browser is used, depending on the value of the use-private-html-browser configuration option.
When a matching file is selected in the results field, the particular text lines in that file that contain the matches are listed in this widget at the bottom of the dialog. This may allow you to see whether the selected file is of interest without opening it in the editor. You can jump directly to one of these text lines in the editor either by double-clicking on a particular text line or by selecting it and then pressing the Enter key or clicking the Open button. An invisible split-bar just above this widget allows you to stretch it taller to see more matching lines.
When the editor is selected, you can quickly display the next file in the Find In Files dialog's list of matching files by typing Control-8. This keystroke emulates switching back to the Find In Files dialog, selecting the next file in the results field, and opening it. You would typically do this just after Search | Find Again reports no more matches in the current editor buffer. (To see other special editor keystrokes that aren't on the IDE's menu bar, use Help | Shortcut Keys.)
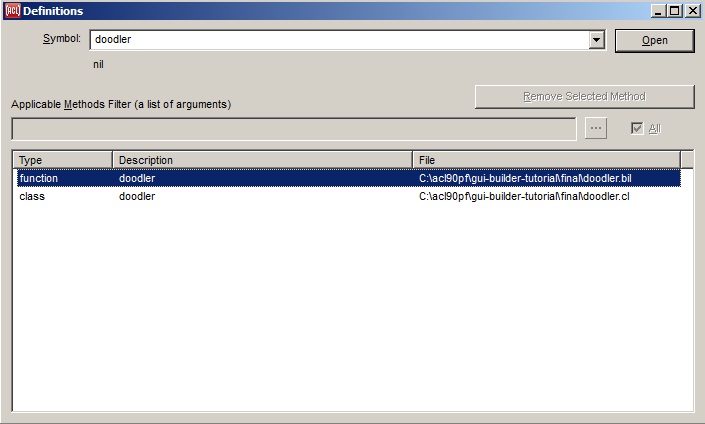
The Definitions dialog can be used to list all of the existing definitions for a symbol, and also to locate and edit the source code for a selected definition. The definitions include all functions, methods of generic functions (including class accessors), macros, variables, constants, standard classes, and structure classes that are named by the symbol. The dialog may also be used to remove individual methods from the Lisp environment.
This dialog is displayed by the
Search | Find Definition command. It is also displayed by the Find Definition or Find Applicable Methods commands on the shortcut (right button) menus in certain windows.
Above is the Definitions window listing the definitions of the symbol doodler. We have loaded the final tutorial project file (gui-builder-tutorial/final/interface-builder-tutorial.lpr), and both a function and a class named doodler have been found.
To use the dialog, invoke the Search | Find Definition command. If a symbol was selected at the time, it will be placed into the Symbol text widget at the upper left of the dialog (it says "doodler" in the picture). If this is not the symbol whose definitions you want to list, then type or paste the desired symbol into the Symbol widget. As you type each character, if you have named a symbol that has any definitions, then a bit of information will appear in a static-text widget just beneath the symbol widget, such as the parameter list of a function. Pressing the Find/Open button at the upper right will then list all definitions for the symbol in the "found definitions" widget at the bottom of the dialog. (The button is labeled Find before searching and Open after a search is complete. The illustration is after a search, so the button is labeled Open.)
Once some found definitions have been listed, the Find button becomes an Open button; pressing it will edit the source code for the currently selected definition if the location of the source code is known. The source code location will be known for any definitions that were compiled, evaluated, or loaded in the current lisp session. (When a fasl file is loaded, the dialog assumes that the source code is located in a corresponding file with a .cl extension.) If the editor is already editing the file that contains the definition, then the definition will be shown in the existing editor buffer that contains it.
The Find/Open button is the dialog's default-button when it says Find as well as when it says Open. Therefore, the main Enter key may be pressed to list a symbol's definitions when there are no definitions currently listed, and may be pressed again to edit a selected definition. The button will say Open whenever any found definitions are currently listed, and will say Find otherwise. Typing into the Symbol widget or invoking the Search | Find Definition command again always clears the list of found definitions and changes the button to say Find.
Note that if you have the Common Graphics/IDE source code installed in your Allegro directory, then you can use the Definitions dialog to find all CG/IDE definitions by first calling the function load-cg-source-file-info. (If you attempt to locate a CG or IDE definition without first calling this function, a dialog will appear that offers to call the function for you. After calling the function, you will need to do the Find Definitions command again to locate the source code.)
The Applicable Methods Filter is an editable-text widget that may contain a list of applicable arguments to filter out found methods that are not of interest. If this widget does contain such a list of argument values, then any found methods that are not applicable to those arguments are excluded from the list of found definitions. This widget is available only when the All check-box is unchecked, since checking the All check-box overrides the applicable arguments widget and shows all found definitions. The All check-box itself is available only when methods have been found.
Typically the applicable arguments widget is filled in automatically. This happens whenever the Find Definitions command is invoked from the Trace Dialog's main outline widget or from a Debug Window backtrace pane. In each of these panes, the selected value denotes a function call that has occurred, including the arguments that were passed. Invoking the Definitions dialog in one of these panes places the list of the function call's arguments into the applicable arguments widget of the Definitions dialog, so that the dialog will list only the methods that might have been invoked by the selected function call (though all non-method definitions for a symbol are always listed).
You may also type in a list of applicable arguments explicitly. To do so, first uncheck the All check-box if it is checked. (This check-box causes all methods to be listed whenever it is checked, and the applicable arguments widget is available for typing or pasting only when All is unchecked.) Then in the applicable arguments widget, type an expression that will produce the desired list of applicable arguments when evaluated, and press the main Enter key to evaluate the expression and list the definitions that exclude any non-applicable methods. The expression entered is always evaluated because it is impossible to literally type most argument values. (It's an exception that pressing Enter while the keyboard focus is in this widget will always evaluate the expression there (if newly entered) and then do a Find, even if the Find/Open button currently says Open.)
If the Methods text widget is not roomy enough to easily enter this expression, you may click the ellipsis button (just to the right of the editable-text widget) to enter the expression into a modal dialog containing a multi-line-editable-text widget instead.
When a found method is selected, the Remove Selected Method button may be pressed to remove the method from the Lisp environment. This can be handy, for example, when you edit a method and change one of the classes that it specializes on, or change an :after method into an :around method. In these cases, the earlier method with the original specializers and qualifiers will still exist in the Lisp environment along with the new version, and this can affect the behavior of your application. By listing all of the methods in this dialog, you can see which ones still exist and easily remove the obsolete methods.
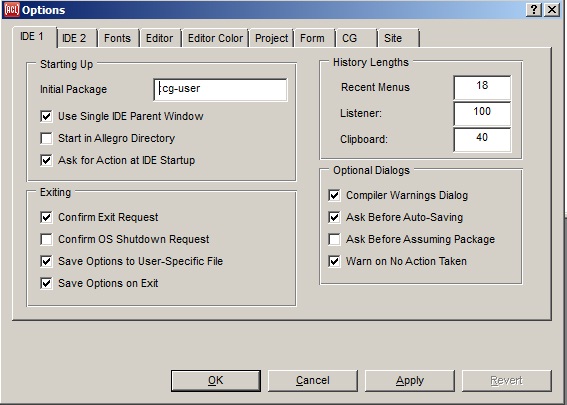
The Options dialog is displayed by clicking Tools | Options. It allows you to customize aspects of the working environment.
Changes that you make using the Options dialog (or the configuration object) are saved to the file allegro-ide-options.cl when the Tools | Save Options Now command is used, or when the IDE is exited if the Tools | Save Options on Exit option is enabled (as it is by default). When you restart the IDE, it will be configured as it was when options were most recently saved.
There are nine tabs on the options dialog:
A tab of the Options Dialog.
A tab of the Options Dialog.
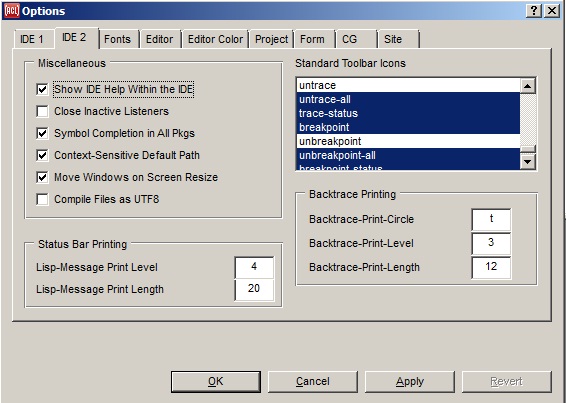
These two tabs of the Options dialog allows setting values relevant to the IDE progamming environment.
The Starting Up group: items in this group relate to how Lisp starts up. The items are:
Initial Package: specifies the value returned by the default
initial-package method.
Use Single IDE Parent Window: specifies whether the use-ide-parent-window option is enabled. If checked, the IDE will use a single parent window that encloses all of its tool windows. If unchecked, it will instead use a single owner window that lets the various tool windows float freely on the screen. The unchecked option does not work well on X11 platforms. A change to this option will be in effect only when you restart the IDE (and a dialog will remind you of that).
Start in Allegro Directory: specifies the default (checked is True, unchecked is nil) value returned by start-in-allegro-directory. Checking this box is usually only necessary if you start by double-clicking a dxl or exe file or by a custom Emacs command.
Ask for Action at IDE Startup: if checked, the Startup Action dialog will appear when the IDE is started. This dialog asks whether to open a recently-used project, open some other project, create a new project, or proceed without a current project.
The Exiting group: items in this group relate to what Lisp does when you tell it to exit. The items are:
The History Lengths group: items in this group specify how much interaction history of various types should be stored. The items are:
The Optional Dialogs group: items in this group specify whether modal dialogs (which require user action) should appear under certain conditions. These dialogs are enabled by default to provide helpful feedback, but once you are very familiar with the interface you may want to turn one or more of them off in order to work more quickly. The items are:
The Miscellaneous group: items in this group concern various miscellaneous things which do not fit elsewhere. The items are:
The Status Bar Printing group: the items allow specification of the print level and print length in the main IDE status bar on the Project Window. The Project Window contains the IDE menus and toolbars along with the main IDE status bar. The items are:
Lisp-Message Print Level: the value of *print-level* when printing status bar messages. See lisp-message-print-level.
Lisp-Message Print Length: the value of *print-length* when printing status bar messages. See lisp-message-print-length.
The Standard Toolbar Icons multi-item-list: this control allows you to customize the toolbar on the Project Window. The Project Window contains the IDE menus and toolbars:

The multi-item list shows the various possible toolbar icons either selected or not (all the illustrated ones are selected; you would have to scroll down to see unselected ones). All unselected icons are on the Extended Toolbar, displayed (as a floating palette) by the View | Extended Toolbar command. If you change which icons are selected and apply the changes, the toolbars are redisplayed according to your choices. A gap is the vertical line dividing groups of toolbar icons.
The Backtrace Printing group: items in this group control the printing of backtraces in the Debug window after an error. The items are:
A tab of the Options Dialog.
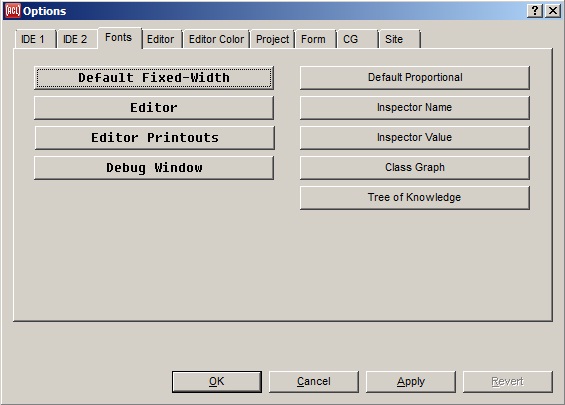
This tab of the Options dialog deals with various IDE default fonts and fonts used by some dialogs, menus, etc.
The affected fonts are:
A tab of the Options Dialog.
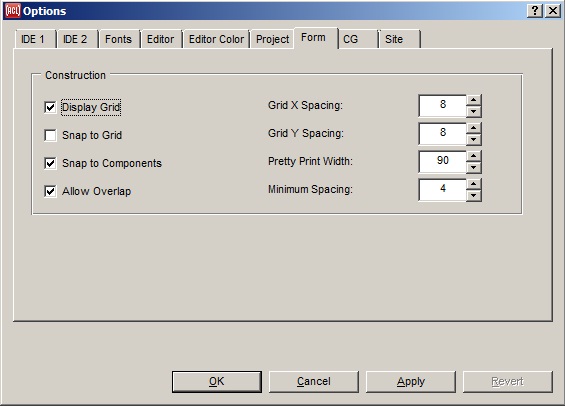
This tab of the Options dialog allows choosing features of forms. A form, recall, is a window used to design other windows. There are four check boxes and four editable text boxes showing numeric values.
A tab of the Options Dialog.
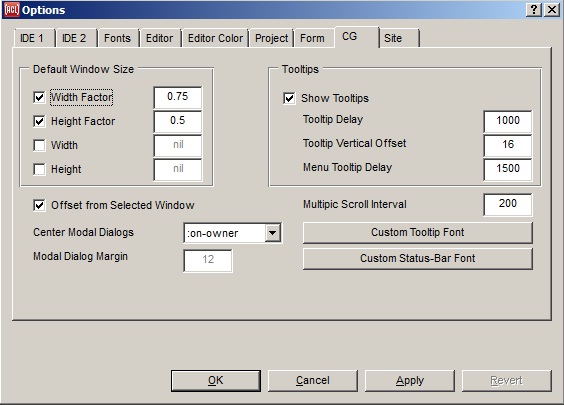
This tab of the Options dialog groups together the options that affect not only the IDE, as the options on all of the tabs do, but also affect standalone Common Graphics applications. (In addition to the options on this tab, the two buttons on the Fonts tab for fixed-font and proportional-font can affect Common Graphics apps as well.) In a standalone Common Graphics app, you would use an expression such as:
(setf (show-tooltips (configuration *system*)) nil)to turn off all tooltips in your application entirely, for example. (To change a different property, replace show-tooltips with the desired property generic function.)
The Default Window Sizes Group. The options here allow you to specify the sizes used when a window is created without specified dimensions.
nil is specified for Width below. See default-width-factor.nil is specified for Height below. See default-height-factor.The Tooltips Group. The options here allow you to specify tooltip behavior.
The other items on the dialog are:
nil. See modal-dialog-margin.nil. If the value has been changed to a font object, clicking on the button will first display a dialog asking if you want to revert to the default, and only display a font choice dialog if you answer no.nil. If the value has been changed to a font object, clicking on the button will first display a dialog asking if you want to revert to the default, and only display a font choice dialog if you answer no.A tab of the Options Dialog.
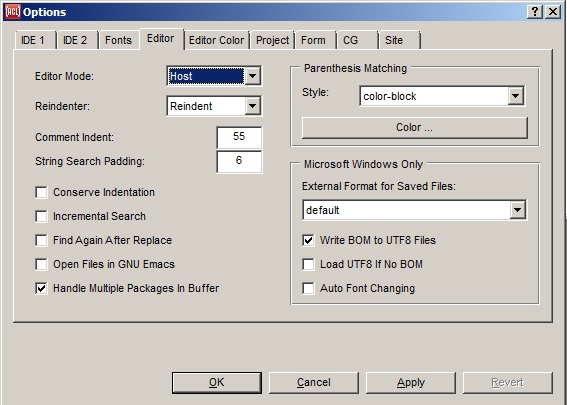
This tab of the Options dialog displays options associated with editing.
nil. This property controls indentation of Lisp code in Editor buffers.A tab of the Options Dialog.
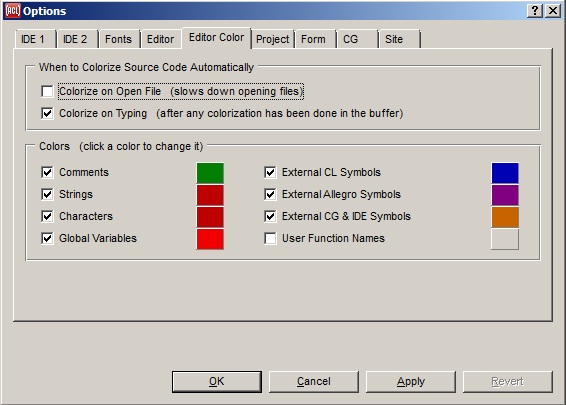
This tab of the Options dialog controls optional colorization of source code in the IDE editor (and in any lisp-edit-panes that are used in applications).
Colorize on Open File: If this is checked, then colorization is done automatically when a file is opened in the IDE editor (or when an application calls load-file on a lisp-edit-pane). It is off by default because it significantly delays the opening of files, especially larger files. See colorize-on-load-file. As an alternative in the IDE, there are commands on the Edit menu menu for colorizing on demand only.
Colorize on Typing: If this is checked, then colorization is done as source code is edited if any colorization has been done in that editor buffer (or other lisp-edit-pane) already. (In the IDE, a new buffer is also marked as already-colorized if Colorize on Open File was enabled when the buffer was created.) See colorize-on-typing.
The other eight options determine whether particular types of source code elements are colorized at all, and the color to use for each type. Click a check-box to toggle whether something is colorized, and click the square color button to change the color that is used for that type of element when it is colorized at all. If you would rather set the specific RGB integer values textually instead of using the color dialog, you could do this in the list of all CG configuration options that is shown in the Inspector by the Tools | Inspect System Data | CG Configuration Options menu command; the ten options all begin with the word "color".
If the default color scheme results in too much colorization, then you may prefer (for example) to disable colorization for the various types of external non-user symbols, but continue to color comments and strings. Colorization will also be faster when fewer things are colorized. On the other hand, colorizing external non-user symbols can point out when you are about to unintentionally redefine a CL symbol or when you have misspelled a CL or Allegro symbol.
See also colorize-source-code.
A tab of the Options Dialog.
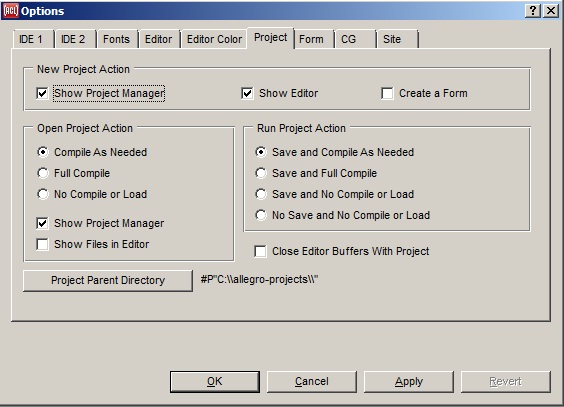
This tab of the Options dialog shows options associated with projects.
New Project Action: these options specify the actions whenever a new project is created. The options are:
Open Project Action: these options specify which files of a project will get compiled when a project is opened for continued development in the IDE. See open-project-action. The radio buttons display the first three options, only one of which may be chosen:
The two check boxes control what is displayed when a project is opened.
Run Project Action: these options specify which files of a project will be saved and/or get compiled when a project or form is run. See run-project-action. The options are:
nil, then the modified modules are saved automatically and then the project or form is run (though canceling from the file selection dialog for a module that has not yet been saved will still avoid running the project or form). No files are compiled.Close Editor Buffers With Project: if this is checked, when a project is closed, all buffers in the Editor currently open to project files are also closed.
Project Parent Directory: this button allows you to change the default parent directory for all new projects. See project-parent-directory.
A tab of the Options Dialog.
This tab of the Options dialog displays information only. The values cannot be set with this dialog.
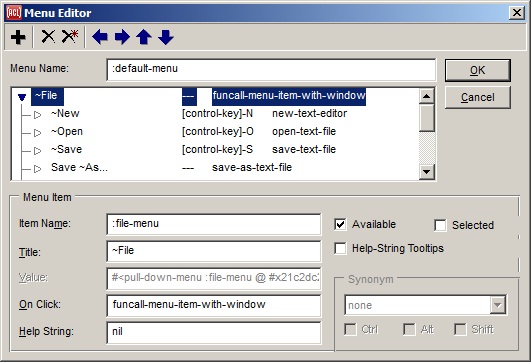
The menu editor allows you to design menus for Window menu bars. It does not support designing of pop-up menus.
This is a modal dialog. You must click on OK or Cancel (or click on the close box, equivalent to Cancel) before doing anything else in the IDE.
This dialog is displayed in two ways.
From the Inspector window inspecting a form. Click on the extended editor button in the menu field when a form is inspected.
Using the Edit Menu Bar menu command on the Form menu. This command will only be present when the current form already has a menu bar. If the current form does not have a menu bar, Add Menu Bar will be on the Form menu. Choose that to add a menu bar. Doing so also displays the Menu Editor dialog.
Menu bars can be removed from a form by making the value of the menu property nil (using the Inspector) or by choosing Form | Remove Menu Bar.
Menus are displayed using an outline control. The first level (all the way to the left) identifies menus on the menu bar. An item in an indented level is either a menu-item (if it is a leaf in the outline) or a submenu (if the item itself has subitems). Clicking right on a value in this outline now selects the value and shows a shortcut menu of appropriate commands for it.
The remainder of the dialog has the following fields and components.
The toolbar: The toolbar has seven buttons.
The PLUS button: clicking this adds a new item to the menu, just below the selected item.
The X button: deletes the selected item of the menu. All subitems of the deleted item will also be removed.
The X* button: delete all items. This results in the null menubar which does not display on the window. This is roughly equivalent to changing the menu property of the form to nil. A confirmatory dialog is displayed when you click this button, to ensure that you really want to delete all items.
The left arrow button: unindent by one level (if possible) the current item.
The right arrow button: indent by one level (if possible) the current item.
The up arrow button: move the current item above the item at the same level above it. A subitem cannot be moved above the item it is indented from. Thus, this button will not move a subitem of one item to become a subitem of a different item.
The down arrow button: move the current item below the next item at the same level.
The name field: Displays the symbol naming the menu. We recommend that menus (and other objects) be named by unique keywords. The name can be used by functions such as find-named-object to get a programmatic handle on an object.
The menu hierarchy field: Displays the menubar structure as an outline. Items wholly to the left name menus on the menubar. The contents of a menu on the menubar are the items indented one level in below a menu. Any item that has further indented items below it names submenus. The outline can be manipulated by the buttons on the toolbar described above.
The Menu Item field: The controls in this area describe the currently-selected item.
Item name: a symbol (using a keyword is recommended) which provides a programmatic handle for the item.
Title: a string (quotation marks are assumed and should not be entered) which will be displayed as the title of the item, on the menu bar or as an element of a menu. A tilde (~) preceding a character will cause the character to be underlined (the tilde will not be displayed). Pressing Alt plus that character is equivalent to selecting the menu item.
Value: active only for items that are not menus (i.e. leaves of the outline). The value can be any Lisp object. It is not seen by users but is programmatically available when handling menu selections by users. (The value of a menu is the menu object. This is displayed but cannot be changed when the currently-selected item is a menu.)
On click: active only for menus. The function that is called when an item from the menu is chosen. This function is called with the arguments the menu, the chosen menu item, and the window containing the menu bar. The default, funcall-menu-item-with-window applies the menu-item value (which presumably names a function) to the window. Another predefined function is funcall-menu-item (with arguments menu, menu-item, and stream).
Help string: a string which will be (or can be) displayed in the status bar when an item is selected (i.e. the mouse is over it but not yet clicked).
Available: if checked, the menu item will be available. If unchecked, the item will be unavailable. That means that it will be grayed out in the menu when the menu is displayed and that choosing it has no effect.
Selected: if checked, a check mark appears in the menu next to the title. Any number of items can be selected. The check mark is designed to convey information; it has no other programmatic effect.
Help-String Tooltips: (only available when a menu is selected): if checked, the help-string of any menu-item on the selected menu will be presented as a tooltip just below the menu if the user holds the mouse cursor over the menu-item for menu-tooltip-delay milliseconds. See show-help-strings-as-tooltips.
The Synonym field: This area only applies to items which are not menus. A synonym is a key or a combination of a key and one or more modifiers. Entering this combination (when the window has focus) is equivalent to choosing the associated menu item. Specify a synonym by choosing a key from the drop-down list and checking as many modifiers as desired. The list includes the numeric keys (on the main part of the keyboard) and the numeric keypad keys.
The default menu-bar that gets attached by the inspector to a form calls four sample functions from its File menu. These functions are exported, but are not available at runtime since a real application would want to implement its own custom version of these functions. The sources are given in the Help page for these default functions, to assist developers in writing their own functions.
(Note that the default Edit menu items for cutting and pasting are useful as is at runtime and so are available in runtime.)
The functions are:
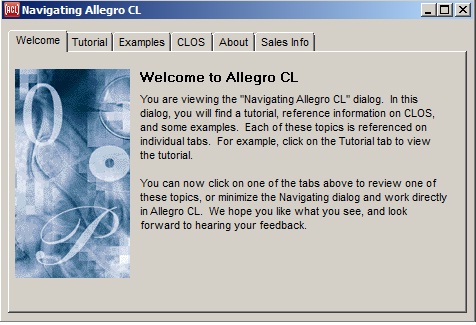
The Navigator is a tab dialog with tabs for Welcome, Tutorial, Examples, CLOS, About, and Sales Info. The Tutorial and Examples tabs are the most useful when writing programs.
Tutorial: displays a brief description of the Interface Builder Tutorial. Clicking on the Start button starts the tutorial.
Examples: displays a list widget listing example topics on how to write CL code. Has buttons Load, Run, and Edit.
Load: causes the example code to be loaded (but not run).
Run: causes the example to be run (loading it if necessary).
Edit: causes the example source file to be displayed in a text-edit window. The examples do common things, especially with windows, dialogs and widgets. You can mimic the example code to achieve similar effects in your code.
CLOS: displays a small description on CLOS. Click the Show button to view an excerpt from the book, ANSI Common Lisp by Paul Graham, 1996, which gives an excellent overview of ANSI Common Lisp and the Common Lisp Object System.
About: displays a short paragraph about Allegro CL.
Sales Info: displays electronic mail, phone, web, and fax contacts for sales information at Franz Inc.
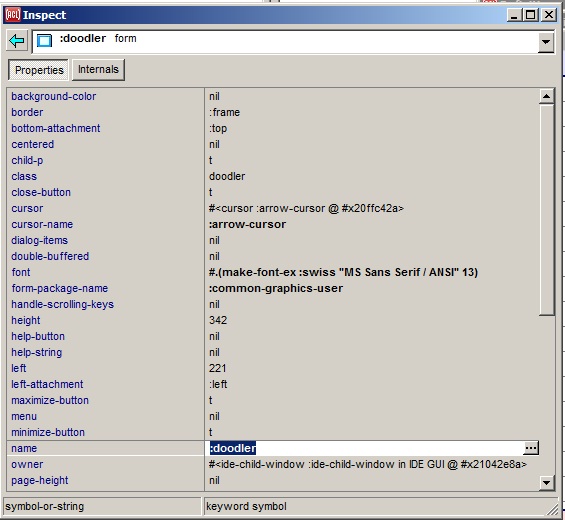
The Inspector window displays information about objects. The same information is displayed (when not in the IDE) using the function inspect and the various inspector top-level commands documented in the inspector.html.
This dialog is displayed by the various Inspect commands on the Tools menu, such as Tools menu | Inspect Selected Object. It is also displayed (even when the IDE is not running but is loaded) by the operators ide-inspect and ide-inspect-standalone.
The illustration shows an Inspector window inspecting a form. We describe the various fields and controls on the Inspector, and the right button menu.
The buttons at the top (in the illustration, Properties and Internals, other objects may have more or different buttons), indicate what pane of the window is visible. In the illustration, the Properties pane is visible and the button looks pressed. Properties are usually changeable aspects of the object while Internals should not normally be modified. Controls have an Events button listing the event functions called when certain mouse events occur over the control.
The Inspector lists various component parts or other attributes of the object that is being inspected, with the name of the part appearing in the lefthand column and its value in the righthand column. The component parts of a standard object, for example, are its slots, whereas the parts of a list are the list's elements, with the indices of the elements serving as the part names. If the inspected object is a standard-object or structure-object, then the home package of each slot name symbol is also shown in the left column.
Each value is printed according to the IDE options dialog-print-level, dialog-print-length, dialog-print-array, and dialog-print-circle, which can be set on the IDE 2 tab of the Options. If the printed representation doesn't fit in the single-line table cell that's provided for it, you can see the full text (or much more of it) in a large tooltip window by holding the mouse cursor over the value in the righthand column. Even if the value does fit as printed, a tooltip will still appear if a longer representation will be printed by extending the printer variables *print-level*, *print-level*, and *print-array*. Specifically, the tooltip will use a *print-level* that's one greater than the IDE option dialog-print-level, a *print-length* that's triple the value of dialog-print-length, and with *print-array* always true. The necessary hovering time for the tooltip to appear is controlled by the Common Graphics option tooltip-delay, which can be set on the CG tab of the Options.
You can replace the value of most object parts by clicking on the value in the righthand column to select it, and then typing in a new value. This works only if the Lisp reader can return the desired type of value from the string that you type. Alternately, you can click on the small extended editor button at the right end of the selected row to show a dialog for editing the value in a more powerful way. On the Internals tab, the extended editor will always be a text-editing window where you can enter a Lisp form that will be evaluated to produce the value to use. On the Properties tab, a more specialized dialog may appear that's designed for editing the particular type of value that the property is declared to have, such as the font dialog when the property is declared to hold a font. The image on the extended editor button indicates which specialized dialog will appear.
Clicking on a part name in the lefthand column will inspect the value of that part. Then clicking the left arrow button at the upper left of the inspector will return to the first object.
The drop-down list at the top shows a history of the objects that have already been inspected by this inspector. The objects are arranged into a hierarchy, where objects that were inspected by clicking in the left column of the inspector are indented just below the objects from which they were inspected; otherwise more recently inspected objects appear toward the top of the list. Clicking an item in this list re-inspects it.
A pixmap appears at the left of each item in the drop-down history list to make it easier to find objects of various types. By default, widgets are identified with the pixmaps that are used for them in the Component Toolbar, windows display a picture of an empty window, all other first-class objects (instances of standard-object or structure-object) display a solid gray dot, and all remaining objects show a hollow dot. These pixmaps (except for the dots) also appear in the always-visible part of the history widget for the currently inspected object, and appear in the rows of the inspector body when it is inspecting a sequence.
The inspector may be customized to show additional pixmaps for other types of objects by defining pixmap methods.
The button with a left-pointing arrow at the upper left of the inspector re-inspects the previously-inspected object. Clicking this button multiple times will re-inspect successively older objects from the inspector history. Or use your mouse's back button if it has one.
The status bars at the bottom show the type of value accepted (on the left) and information on the value on the right.
Right-clicking in the inspector shows a pop-up menu of additional inspector commands. A child menu of this menu shows further inspector commands that are more easily accomplished in other ways but are shown as a reminder of their keyboard shortcuts. Here are the inspector-specific commands on the main pop-up menu:
:calls as the relation argument. Callers are known only when *record-xref-info* and *load-xref-info* are true when the code is compiled and loaded respectively; those variables are always true by default in the IDE.:uses as the relation argument. Users are known only when *record-xref-info* and *load-xref-info* are true when the code is compiled and loaded respectively; those variables are always true by default in the IDE.(gc t) (see gc) and/or use the Clear History command on this same menu and the Clear History button in the Debug Window's toolbar and the Clear button on the Trace Dialog.When you inspect a long list or vector, the inspector will initially display only the first fifty elements, for efficiency reasons. To display the next set of fifty elements, you simply need to scroll to the bottom of the ones that are displayed so far. You can do that either with the keyboard (using the PageDown key or the down arrow key) or with the mouse (by dragging the scrollbar or pressing its lower arrow button).
The Properties and Events tabs also provide brief documentation on how to access an object programmatically (assuming that properties are defined for the object). The function for reading the value of a property almost always has the same name as the property.
Thus if you notice in the inspector that an object has a property called border, this means that you can read the current value of that property with a form such as
(border my-object)Likewise, the writer function is almost always the setf of the property name, and the initarg for specifying the property value when creating the object is almost always the corresponding keyword. So
(setf (border my-object) :frame)would set the border property, and an initarg/value pair such as
:border :framewould initialize the border when creating the object.
A property value is displayed in a bold font if it is not equivalent to the programmatic default value for that property. This highlights values that you have changed, as well as some sample values that are given to widgets that you place onto forms (and which you typically will want to change). A read-only value will never be bold. A handful of properties are never shown bold because they generally do not have meaningful default values and are more distracting than useful when made bold; these exceptions include the properties child-p, class, tab-position, left, top, width, height, dialog-items, and pixmap-use-handle.
Brief help information is supplied in the main Allegro status bar when a property is selected in the inspector, and for more detailed help (or to make sure that the accessor functions really have the same name) you can invoke the Help | Help On Selected Symbol command (shortcut F1) while the property or event handler of interest is selected in the inspector.
For further information on using properties programmatically, refer to defproperties or define-property.
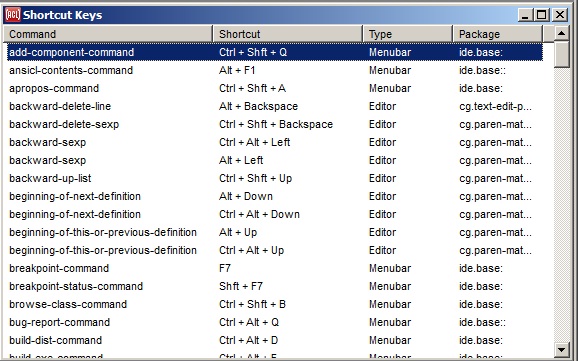
This dialog, which lists all of the shortcut keystrokes that are currently in effect in the IDE, is displayed by the Help | Shortcut Keys command. Each line shows the name of a function, the keystroke that calls the function, the type of command, and the package of the function. (Most of the functions are not exported from the cg package for general use in applications, but the function names serve as command names nevertheless.)
The Type column indicates whether each command is defined on the IDE's menu bar, or by the editor's current comtab (command table), or as a global shortcut. The menu bar keystrokes are applicable in a variety of IDE windows, while the editor keystrokes are applicable only in editor and listener panes. A different set of editor commands, with different keystrokes, will appear in this list depending on the current editor comtab (see editor-mode). Global shortcuts are defined with add-global-keyboard-accelerator.
As you select different commands in the list, a brief description of what the command does will appear in the main status bar at the bottom of the IDE.
When this dialog is selected, the File | Print command will print the entire list of key bindings, complete with each command's help string. The printed list will be in the order in which the dialog is currently sorted. See also the function comtab-report, which can either present this dialog or print the bindings as a plain text table to an arbitrary output stream.
Help on these commands is not directly accessible from this dialog. To find the documentation for the menu bar commands, expose one of the pull-down menus, highlight one of the commands on it, and press the F1 key to show the help page for that menu.
The editor keystrokes are documented only in the table below. This table shows the keystrokes of both the Host and the Emacs editor modes (the Brief mode is not known to be used). A triple dash (---) means there is no keystroke for that command in that editor mode. This table was generated by a call to comtab-report.
If you would like to use the IDE editor's keystrokes in a Common Graphics application, the functions cg-host-comtab and cg-emacs-comtab return a subset of the IDE editor's keystrokes that are not specific to the IDE.
The term "cut" here means to delete text and place it onto the system clipboard. To "delete" text simply removes it without placing it onto the clipboard. To "copy" text is to place it onto the clipboard without modifying the editor buffer.
| Function | Host Mode | Emacs Mode |
| backward-character: Moves the text cursor backward by one character position. | --- | Ctrl+B |
| backward-delete-line: Deletes from the text cursor position to the beginning of the current line. | Alt+Backspace | --- |
| backward-delete-sexp: Deletes the lisp form that preceeds the text cursor. | Ctrl+Shft+Backspace | --- |
| backward-kill-line: Cuts the text between the beginning of the current line and the text cursor, if any. | --- | Alt+K |
| backward-kill-sexp: Cuts the lisp form before the text cursor. | --- | Ctrl+Alt+Backspace |
| backward-kill-word: Cuts the word before the text cursor. | --- | Ctrl+Backspace Alt+H Alt+Backspace |
| backward-list: Moves to the start of the previous list at the current level. | --- | Ctrl+Alt+P |
| backward-sexp: Moves backward by one lisp form. | Ctrl+Alt+Left Alt+Left |
Ctrl+Alt+Left Ctrl+Alt+B |
| backward-up-list: Moves to the start of the lisp form that surrounds the text cursor. | Ctrl+Shft+Up | Ctrl+Alt+Down Ctrl+Alt+U |
| backward-word: Moves the text cursor to the start of the current or previous word. | --- | Alt+Left Alt+B |
| beginning-of-buffer: Moves the text cursor to the beginning of the buffer. | --- | Alt+Shft+Comma |
| beginning-of-line: Moves the text cursor to the beginning of the current line. | --- | Ctrl+A |
| beginning-of-next-definition: Moves the text cursor to the next beginning of a top-level form. | Alt+Down Ctrl+Alt+Down |
Ctrl+Alt+Close-Square-Bracket |
| beginning-of-this-or-previous-definition: Moves the text cursor to the previous beginning of a top-level form. | Alt+Up Ctrl+Alt+Up |
Ctrl+Alt+Open-Square-Bracket Ctrl+Alt+A |
| capitalize-selection: Capitalizes each word in the currently selected text. | --- | Alt+C |
| delete-file-command: Deletes the file that an editor pane is editing, if confirmed. | Alt+Shft+D | Alt+Shft+D |
| delete-horizontal-space: Deletes whitespace around the text cursor on the current line only. | Ctrl+Slash | Ctrl+Slash |
| delete-indentation: Deletes any spaces at the beginning of the current text line. | --- | Ctrl+6 |
| delete-line: Deletes from the text cursor position to the end of the current line. | Alt+Delete | --- |
| delete-next-character: Deletes the character at the text cursor. | --- | Ctrl+D |
| delete-previous-character: Deletes the character before the text cursor, or the selected text if any. | Ctrl+H | Ctrl+H |
| delete-sexp: Deletes the lisp form that begins at the text cursor. | Ctrl+Shft+Delete | --- |
| delete-surrounding-whitespace: Deletes all whitespace surrounding the text cursor, extending to adjacent lines of text. | Alt+Slash | Alt+Slash |
| down-list: Moves the cursor to after the opening parenthesis of the next list at the current level. | --- | Ctrl+Alt+D |
| downcase-selection: Changes the currently selected text to lowercase. | --- | Alt+L |
| edit-file: Edits a file in a new IDE editor pane. | --- | Ctrl+X Ctrl+F Ctrl+X Ctrl+V |
| end-of-buffer: Moves the text cursor to the end of the buffer. | --- | Alt+Shft+Period |
| end-of-definition: Moves the text cursor to the end of the current top-level form. | --- | Ctrl+Alt+E |
| end-of-line: Moves the text cursor to the end of the current line. | --- | Ctrl+E |
| find-in-next-find-in-files-buffer: Edits the next file that's listed in the Find In Files dialog, and selects the first string match. | Ctrl+8 | Ctrl+8 |
| forward-character: Moves the text cursor forward by one character position. | --- | Ctrl+F |
| forward-list: Moves the text cursor to the end of the next list at the current level. | --- | Ctrl+Alt+N |
| forward-sexp: Moves the text cursor forward by one lisp form, or to the end of the current form. | Alt+Right Ctrl+Alt+Right |
Ctrl+Alt+F Ctrl+Alt+Right |
| forward-up-list: Moves the text cursor just past the form surrounding the text cursor. | Ctrl+Shft+Down | Ctrl+Alt+) |
| forward-word: Moves the text cursor to the end of the current or next word. | --- | Alt+F Alt+Right |
| go-to-character-index-command: Jumps to a user-specified character index in the editor. | Alt+Shft+G | Alt+Shft+G |
| illegal-operation: Beeps. | --- | Ctrl+X Ctrl+G Ctrl+G Alt+G |
| indent-for-comment: Begins a comment on the current line at the comment-indent position. | Ctrl+Semicolon | Ctrl+Semicolon |
| insert-empty-list: Inserts a pair of parentheses at the text cursor position and leaves the cursor between them. | Ctrl+Shft+3 | Alt+9 |
| insert-empty-string: Inserts two double quote characters at the text cursor position, and leaves the cursor between them. | Ctrl+Shft+2 | Alt+Shft+2 |
| just-one-space: Replaces the zero or more spaces about the text cursor with a single space. | Ctrl+Alt+Slash | Ctrl+Alt+Slash |
| kill-comment: Deletes an in-line comment on the current line, if there is one. | --- | Ctrl+Alt+Semicolon |
| kill-line: Cuts from the text cursor to the end of the line, or deletes the newline at the cursor. | --- | Ctrl+K |
| kill-sexp: Cuts the lisp form that contains the text cursor. | --- | Ctrl+Alt+K |
| kill-word: Cuts from the text cursor position to the end of the current or next word. | --- | Alt+D |
| list-buffer-definitions-command: Lets you select one of the buffer's definitions to edit, listed in top to bottom order. | Ctrl+Comma | Ctrl+Comma |
| list-buffer-definitions-sorted-command: Lets you select one of the buffer's definitions to edit, listed in alphabetical order. | Ctrl+Alt+Comma | Ctrl+Alt+Comma |
| menu-of-buffers-command: Displays a menu of all of the current editor buffers, and exposes a selected one. | Ctrl+B | Ctrl+X Ctrl+B |
| newline: Inserts a newline character without indenting the new line. | Ctrl+Return | Return Shft+Return Ctrl+M |
| newline-and-indent: Inserts a newline character and adjusts the indentation of the lines just before and after it. | Return Shft+Return |
Ctrl+J |
| next-line: Moves the text cursor one line downward. | --- | Ctrl+N |
| next-page: Scrolls the editor pane downward by one page. | --- | Ctrl+V |
| open-line: Inserts a newline after the text cursor, leaving the cursor just before the newline. | --- | Ctrl+O |
| previous-line: Moves the text cursor one line upward. | --- | Ctrl+P |
| previous-page: Scrolls the editor pane upward by one page. | --- | Alt+V |
| quick-symbol-info-on-space: Displays (in the status bar) the argument list of the symbol before the text cursor. | Space | Space |
| recenter: Scrolls the text line containing the text cursor to the vertical center of the window. | Ctrl+Space | Ctrl+L |
| reindent-sexp: Adjusts the indentation of the lisp form just after the text cursor. | --- | Ctrl+Alt+Q |
| reindent-single-line: Adjusts the indentation of the line that contains the text cursor. | Tab | Tab |
| reverse-search-direction-command: Reverses the current direction in which Search | Find Again will search for a string. | Ctrl+Shft+V | Ctrl+Shft+V |
| select-current-sexp: Selects the symbol, string, or lisp form at the text cursor position. | Ctrl+Shft+Return | Ctrl+Shft+Return |
| select-left-page-command: Exposes the pane or tab that is to the left of the selected one. | Ctrl+Shft+Comma | Ctrl+X Left Ctrl+Shft+Comma |
| select-other-page-command: Exposes the most recently selected pane or tab. | Ctrl+Shft+J | Ctrl+X O Ctrl+Shft+J |
| select-previous-other-page-command: Exposes the second most recently selected pane or tab. | Ctrl+Shft+K | Ctrl+Shft+K Ctrl+X P |
| select-right-page-command: Exposes the pane or tab that is to the right of the selected one. | Ctrl+Shft+Period Ctrl+X | Ctrl+Shft+Period Right |
| select-third-other-page-command: Exposes the third most recently selected pane or tab. | Ctrl+Shft+L | Ctrl+X Left-Windows |
| transpose-characters: Swaps the character at the text cursor with the previous character. | Ctrl+Quote | Ctrl+T |
| transpose-sexp: Swaps the selected lisp form with the previous one. | Alt+Quote | --- |
| upcase-selection Changes the currently selected text to uppercase. | --- | Alt+U |
| zoom-editor Maximizes or unmaximizes the editor workbook. | --- | Ctrl+X Z |
This dialog displays an outline of the available Common Graphics/Integrated Development Environment documentation and much general Allegro CL documentation. Double-clicking on a leaf item (i.e. one that does not have subitems), or pressing the SPACE bar or the F1 key while the leaf item is selected, displays the relevant documentation, typically the relevant page in this help file, but Navigator examples are also displayed by some leaf entries.
The Search | Find Forward or Search | Find Backward command in this dialog opens the outline as necessary to find all relevant entries and highlights them.
The entries in the tree are identified by various icons. In the illustration, the tree entry Using this Help Outline | Type of Help Entries is open and describes the visual clues provided by the icons.
The tree (which is an instance of an outline widget) can be navigated quickly by pressing the J, K, F, and D keys as alternatives to the down, up, right, and left arrow keys respectively, and the T and B keys for the Home and End keys. This works because the outline widgets in IDE tool dialogs enable their handle-home-key-shortcuts property.
This dialog is displayed with the Help | Tree of Knowledge menu command.
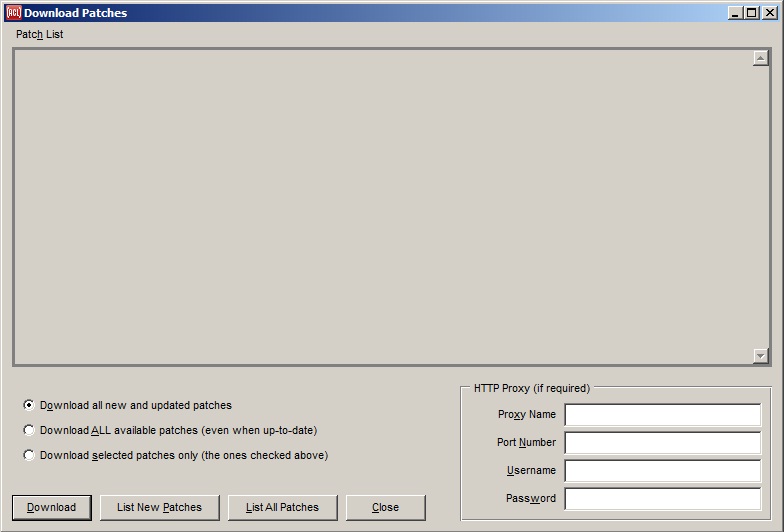
This dialog sometimes appears just after the IDE has started up to remind you that you may want to check for new Allegro patches that you have not yet downloaded.
Pressing the List New Patches Now button will show the Download Patches dialog and will automatically press its List New Patches button. You can then press that dialog's Download button to download the listed patches, or just close the dialog to do nothing.
The drop-down list labeled How often to show this reminder dialog allows you to control how often the reminder dialog will appear in the future. Selecting a value here calls (setf patch-reminder-interval) to set the number of days between reminders. (That is done even if you then cancel from the dialog.) Here are the choices in the drop-down list and the values that they pass to (setf patch-reminder-interval)).
nilIf you prefer to use the Install | Updates command or to call update-allegro whenever you choose, then you may want to choose Never here to disable the reminder dialog.
The patch-reminder-previous-time value will be reset to the current time either when the patch reminder dialog appears or when you actually download any patches in the Download Patches dialog (regardless of whether it was invoked by the reminder dialog). The reminder dialog will not appear again until the selected time interval has passed from that point. The previous time is not reset by calling update-allegro directly though.
The IDE's Class Interface Editor dialog is used to interactively create a graphical user interface (GUI) for editing the instances of a class. Typically this user interface is for editing information in an AllegroCache database, though it could be used to edit arbitrary class instances.
You can use the Class Interface Editor to edit either an object-editor dialog or a class-grid widget. An object-editor dialog contains a widget for each slot of interest, while a class-grid widget contains a grid column for each slot instead. These interface objects will automatically create and lay out their widgets or grid columns according high-level parameters that you specify interactively.
Specifically, the Class Interface Editor lets you specify the value of the edited-slots property of an object-editor or class-grid. You could alternately specify this property programmatically; see the doc page for the edited-slots property as well as the document cg-object-editor-and-class-grid.html.
The Class Interface Editor is normally used on a form window in a project so that code for recreating the interface objects is saved with the project. So starting from scratch you would create a new project with the File | New Project command. Then you would create either (1) an object-editor form or (2) a generic form with a class-grid on it.
To create an object-editor form, use the File | New Form command as usual. The key step is to select object-editor in the Window Class widget of the New Form dialog that appears. You will then be asked to enter the name of a class for the object-editor to edit. You must enter a class name at this time or the new form will not be created. It's OK to type in the name of a class that doesn't exist yet, though, such as a class in a database that you haven't opened yet.
To create a standalone class-grid on a generic form, first use the File | New Form command to create some other type of form, typically a dialog. Then click on the Class Grid button in the Components Toolbar (the button shows a grid with header cells plus a red "C" in the body) and then click on the form window. This will create a sample class-grid for the class test-person. You may want to run the form with its sample property values to see how it works. Once you've done that, you will probably want to inspect the widget and change its value property to nil to remove the sample rows. Then change the edited-class property to be the name of a class to edit, since you are not prompted for that as with an object-editor.
In case you were wondering, a class-grid can also be used on an object-editor, but that's done in a different way that's covered toward the end of this document.
Now that you have an object-editor form or a class-grid on a form, there are three ways to invoke the Class Interface Editor dialog on it:
Right-click the object-editor form or class-grid and select Edit Class Interface from the pop-up menu.
Inspect the object-editor or class-grid, select the edited-slots property, and click the small button on the right end of that inspector row.
For an object-editor only, select the module for the object-editor form on the Project Manager's Modules tab, and then click on the button in the Project Manager's toolbar whose tooltip is Edit Class Interface. (The two horizontal green bars on this button represent two single-line text widgets aligned in a column on an object-editor, if you appreciate minimalism.)
Here is a Class Interface Editor editing the class dialog, just for illustration:
When the Class Interface Editor appears, a list of all of the slots of the edited class will appear in the Slots widget at the left. If this is a new object-editor or class-grid, then all slot names will be grayed out because no slots have been selected yet for inclusion in the user interface.
Click on the name of a slot that you would like to include in the interface, and then click the Include check-box near the top of the Class Interface Editor. This will make the rest of the widgets in the Widget group-box available so that you can specify how that slot should be edited by the end user. The slot name will also turn from gray to black in the list of all slots, though you can't see that while the slot is selected.
You may now specify how this slot will appear in the interface. For example, in the Label widget you could type a string to display beside the widget for the slot on an object-editor, or in a column header for the slot in a class-grid. If you leave the label widget blank, the default label will be the slot name with dashes converted to spaces, and each word capitalized.
The most interesting part of the Class Interface Editor is in the Data Type group-box. Here is where you specify what sort of data is in an edited slot, and therefore what type of widget or grid column should be used for editing the slot. The Type Name widget is where you select the main data type for the slot. When you select a main type, one or more additional widgets may appear just below; these widgets allow you to specify various options for the selected type.
The data type choices are not lisp types, but rather types that pertain to how the value may be edited. There are several different data type choices that are used for lisp strings, for example.
The default type for any slot is Variable Char, which means that the value may be a string of any length. If you are creating an object-editor, then a simple editable-text widget will be created for editing that slot. If you are creating a class-grid, then an editable-text-column-mixin
If you change the type in the Type Name widget to Fixed Char, then a Max Characters widget will appear. This widget allows you to specify the maximum number of characters that a string in this slot can have. An editable-text widget will still be created for the slot, but it will have a template-string that restricts the user to entering the specified number of characters.
There are a variety of other choices for the data type. For example, Boolean will create a check-box, Single Choice a combo-box, Multiple Choice a multi-item-list (for an object-editor only), and Pixmap will create a static-picture (or a pixmap-column-mixin column in a class-grid). These choices are documented more fully on the doc page for the edited-slots property, but here are notes on how to specify a couple of the less obvious ones on the Class Interface Editor:
Single Choice and Multiple Choice: For these types a multi-line text-editing widget will appear on the Class Interface Editor where you can enter a set of hardcoded choices from which the end user can select values. If you check the Choices Are Strings check-box, then each line of text that you enter will be used as one choice, and the choice will be a that actual string. If Choices Are Strings is not checked, then lisp objects (typically symbols and numbers) will be read from the text that you entered until the end of the text is reached, and those lisp objects will be the choices.
Pixmap and Static Pixmap: this is the one where it is least obvious how to specify the options. The multi-line text-editing widget will appear as with Single Choice and Multiple Choice, but you need to enter values carefully in a certain format. Each line of text is used to map an arbitrary slot value to a pixmap to represent it. A line of text should contain text that will be read as two lisp values, where the first value is the arbitrary slot value and the second value is the name of a pixmap that has been cached by calling cached-pixmap. If a user value is a string then it should have double quote characters around it here. If a user value is not a "readable constant" then the Class Interface Editor cannot be used to specify a pixmap interface for it. So entering the following text would cause the pixmap named :key to be displayed for the slot value :partial, the pixmap named :key-special to be displayed for the slot value :full, and the pixmap named :melvin to be displayed for the slot value "Melvin Ferd" (the string):
:partial :key
:full :key-special
"Melvin Ferd" :melvin
If the Pixmaps Will Strech check-box is checked then the pixmaps will be stretched larger or smaller as needed to fill the available space in the widget or grid cell, and otherwise they will be drawn at their normal sizes.
The Class Interface Editor will create widgets or grid columns in the order that they appear in the list of all slots (ignoring the slots that are not included). This will be widgets from top to bottom in an object-editor dialog, or grid columns from left to right in a class-grid. You can therefore change the order in the list of slots to control the widget order. The Move All Included Slots to the Top button may by handy to use first in order to group all of the currently-included slots together at the top of the list. You can then move individual slots using the Up and Down buttons, or more quickly by left-clicking and dragging slot names to new positions.
If you are creating an object-editor rather than a class-grid, then there will also be a New Column check-box. By default, an object-editor will lay out its widgets in a single vertical column. The exception is that if you check the New Column check-box for a particular slot, then a new column of widgets will be started at the widget for that slot. That can save space vertically.
Pressing the OK button will exit the Class Interface Editor, which will then automatically create or update widgets or grid columns as needed to match your specifications. You can then edit the widgets further using the inspector just as you would widgets on a regular form, and move and resize the widgets or grid-columns with the mouse. You can even add other arbitrary widgets to an object-editor form. The Class Interface Editor doesn't have facilities for specifying properties like a widget's size or font because that would be redundant with the more general tools.
After editing the created widgets of an object-editor directly, you can invoke the Class Interface Editor again at any time. A reinvocation will never resize an existing widget unless you change the data type so that a different type of widget will be substituted. It will not undo general property changes that you have made in the inspector. And by default the only widgets that it will move are any new widgets that it adds for additonal slots that you tell it to include; these new widgets will be arranged below all widgets that existed already (other than the lower row of command buttons, which will still be kept at the bottom). Added widgets will be aligned with each other but not with the pre-existing widgets.
If you check the Redo Entire Widget Layout check-box before exiting the Class Interface Editor, then it will move all widgets (other than any that you created by hand) to align them just as if you had created them all at once. Existing widgets will still not be resized. So if you have begun moving widgets around directly on the object-editor form, then you should not check Redo Entire Widget Layout thereafter, or else it will undo any direct moving of widgets that you have done. On the other hand, if you have not yet moved any widgets directly on the form then you probably DO want to check Redo Entire Widget Layout on each re-invocation of the Class Interface Editor in order to keep all widgets nicely aligned, and in the same order as in the Slots widget. This check-box is never turned on by default to make it less likely that you will accidentally leave it enabled and undo your careful hand-positioning of widgets. This check-box will not appear when editing a class-grid because the grid columns will always be arranged to match the order in the Slots widget.
If you are creating an object-editor rather than a class-grid, then there will be a Buttons widget in the lower right corner. Here you can select any subset of several built-in command buttons that let the user do things such as selecting an instance to display in various ways, or reverting from the current edits. These buttons call exported functions, so alternately you could add your own widgets to the object-editor form later and make them call these same functions. The set of buttons and the functions they call are documented on the page for the command-buttons property.
These widgets let you specify one or two slots whose values will be used as a "pretty name" for an instance. The pretty name will be displayed in widgets that hold class instances, and in menus for selecting instances. The drop-down lists for these widgets let you select any slot.
These widgets usually edit values for the edited-class of the object-editor or class-grid that you are editing in the Class Interface Editor. An exception is that if a slot uses one of the data types for class instances (see further below), then the Primary and Secondary Name Slots widgets will edit values for that slot's class whenever it is selected in the list of all slots.
For more information see primary-name-slot and secondary-name-slot.
The Fixed-Width Font check-box will be checked by default whenever you select a data type that requires a fixed number of characters. You can override that default by toggling this check-box yourself. A widget will use the current global CG fixed-font when this check-box is checked, or the current proportional-font otherwise. (You could change a widget's font in the inspector as usual after the widget gets automatically created.)
If you are creating an object-editor rather than a class-grid, then there will an Include Table of All Instances check-box. If you check this widget, then a special class-grid will be included at the very bottom of the dialog. This class-grid will have a row for every instance of the edited class (and so would probably not be very useful if there is a huge number of instances). The end user can edit instances here as an alternative to doing so in the main part of the dialog. Selecting an instance in the grid will display it in the rest of the dialog as well.
If you are creating a class-grid, then there will be a few other widgets. Three of these are check boxes for whether the grid column will be resizable, proportional, and/or sortable. A resizable class-grid column allows the user to change its width by dragging the right edge of its header cell. A proportional column will be resized proportionally when the width of the class-grid itself changes. And a sortable grid column allows the user to sort the grid rows by that column's values by clicking the column's header cell.
One other widget for class-grids that will appear, though only for certain data types, is the Printer widget. Its value should be the name of a function that takes a data value and returns the string to display for it. It defaults to princ-to-string.
In the list of all slots, a persistent slot whose index attribute is :any will display a yellow key with a single prong, and an index attribute of :any-unique will display a green key with two prongs.
The data type choices for slots that hold class instances are of particular interest in the Class Interface Editor. In the Type Name widget, if you select Class Instance, Static Class Instance, or Table of Class Instances, then a Class widget will appear where you can enter the class whose instances the slot holds. Any classes that are defined in the currently open AllegroCache database will be listed in the drop-down list for easy selection; otherwise you can type in the name of the class. You will then be able to add widgets or grid columns that edit slots of these instances indirectly.
For example, if you are creating an object-editor that edits instances of the patient class, and a patient has a doctor slot that holds an instance of the doctor class, then you could select the doctor slot in the list at the left, set its main data type to Class Instance, and its Class to doctor. At this time a blue arrow will appear beside the doctor slot in the list of all slots. Clicking this arrow will reveal a sublist containing the slots of the doctor class. If you then specify a widget for the phone-number slot of the doctor class, then the object-editor for the patient class will include a widget for the phone number of the doctor of the currently-displayed patient. (If you don't want the end user to be able to change the doctor's phone number while editing a patient, then you should probably specify the Static Text type for that slot.)
If a slot holds a list of instances of some class, and you are creating an object-editor rather than a class-grid, then you can specify the Table of Class Instances type for that slot. This will create a class-grid on the object-editor, where the grid will have a row for each instance in the list.
For example, the patient class could have a prescriptions slot that holds a list of instances of the prescription class. If you are creating an object-editor for the patient class, then you could select the prescriptions slot in the list of all slots, then set its main data type to Table of Class Instances and its Class to prescription. This will create a class-grid on the object-editor for patient that displays a row for each prescription of the currently-displayed patient.
This sort of indirection can be carried to any practical number of levels. For example, the prescriptions table could have a column for the medicine of the prescription of the patient and an indirect column for the manufacturer of the medicine of the prescription of the patient. In the Class Interface Editor, a new level of slot names will be made available for selection whenever you specify one of the class instance data types at a preceding level.
When specifying a Table of Class Instances on an object-editor, there is also a list of buttons that you can select that go along with the grid-widget that gets created. These buttons will create, delete, add, or remove instances in the list of instances that the table's slot contains. This allows the end user to edit the actual list of instances, rather than only to edit each instance that's in the list already. The Create button allows the user to create an instance and add it to the list, while the Add button allows the user to select an existing instance from a menu and add it to the list. Similarly, the Delete button will remove an instance from the list and delete the instance, while the Remove button simply removes the instance from the list without deleting the instance itself. In the prescriptions table example, the Create and Delete buttons are more appropriate because a prescription is unique to a particular patient. If the table held a list of medicine instances instead, where there is only a single instance for each medicine product, then the Add and Remove buttons would be more appropriate.
The Widget Palette has icons for the various components that can be displayed on forms. It is displayed with the Form | Show Widget Palette menu command. You can also display the palette by clicking in the background area of a form window, unless the show-widget-palette-when-click-form option has been turned off.
To add a component to a form, click on the component and then click on the form in the desired location.
The Stepper Dialog allows carefully testing compiled code by interrupting execution at selected forms in the original source code and at macroexpansions of the code, allowing state to be examined at each stop point. The illustration shows the Stepper Dialog stepping through the fact function, which calculates a the factorial of its argument. The definition of fact is shown as described below.
The dialog displays the original lisp source code for a function or method that is being stepped through, highlighting the form at which the stepper is stopped. Button widgets allow proceding in various ways each time execution has been interrupted. The dialog also displays macroexpanded forms and the values of arguments and local variables, updated after each step. The IDE's code editor can be invoked at any time on the code being stepped through.
The dialog is implemented on top of the base lisp's stepping facility, which also has a simpler textual interface that can be used in a lisp listener. See The Lisp DeBug (ldb) stepper and The source stepper, both in debugging.html.
In the IDE, stepping will be done in the Stepper Dialog if it is present when a breakpoint is hit, and otherwise textual stepping will be done in the listener. The Stepper Dialog is present if it has been shown by using the Run | Stepper Dialog command and has not been closed or iconized more recently, and so it is still present if it is simply buried by other windows. (It's recommended that you do not show or close the Stepper Dialog while stopped at a step, or these two modes may become confused.)
In order to successfully step through source code, it's important to do some setup in the right order. Here are the general steps, as it were, for setting up source-level stepping:
Show the Stepper Dialog with the menu bar command Run | Stepper Dialog.
While the Stepper Dialog is present, use IDE menu bar commands to compile and load some code to test. These commands include Compile and Load (for a file), Tools | Full Compile (for the current project), and Tools | Tools | Incremental Compile (for a single definition in the editor). Using an IDE compilation command while the Stepper Dialog is present ensures that the necessary debugging information is available for doing source-level stepping.
One caveat: Compile and Load does not recompile the code if there is an up-to-date fasl file. To ensure recompilation, you could use Compile followed by Load. Or first save a buffer in the editor to ensure that the fasl is no longer newer, and then use Compile and Load. Status bar messages will indicate when compilation was really done.
Advanced explanation: The actual requirement is for particular compiler switches to be enabled when the tested code is compiled. This is done automatically when using IDE commands while the Stepper Dialog is present, but you could alternately manage the compiler switch variables yourself. All of the needed switches will be true if the general debug optimization level is 3, as with (declaim (optimize (debug 3))). The individual switch variables include save-source-level-debug-info-switch for source-level stepping, along with save-arglist-switch, save-local-names-switch, and save-local-scopes-switch in order to display local variable names and whether each variable is currently "dead" and so on.
Add breakpoints to one or more functions or methods by using the Run | Set Breakpoint menu command. To do this, first place the text cursor onto the name of a function in the editor (or elsewhere in the IDE) and then invoke the menu command. A message in the status bar at the bottom of the IDE will mention that a breakpoint has been added. The keyboard shortcut for the command is F7, so you could for example begin typing a call to a test function in the Debug Window, pressing F7 just after typing the name of the function to breakpoint it, and then typing the rest of the expression and evaluating it.
If the selected function name is a generic function, then a pop-up menu will appear where you can select the particular method to breakpoint. The special All choice at the top of the menu will breakpoint all methods. Another way to breakpoint a particular method is to use the Definitions dialog on a generic function, then select one of its methods in the dialog's list and invoke Run | Set Breakpoint.
With the Stepper Dialog still present, run some test code that calls one of the breakpointed functions. A break should occur and bring the stepper dialog to the front with information about the function. You are now ready to step through the definition that is shown, as described below.
After the setup above, if you see the Stepper Dialog with a lisp form in the second pane from the top, then you have successfully initiated source-level stepping, and can proceed stepping through the definition that's shown. If you instead see an assembly language form in the second pane, then review the instructions above for setting up source-level stepping.
The three content panes are unlabeled to save space, due to the typically large amount of content. Here are brief descriptions for now: The uppermost pane of the dialog (the Definition Pane) shows the entire definition that is being stepped through. The second pane from the top (the Form Pane) shows the form at which the stepper is currently stopped. The third pane (the Stack Pane) shows the arguments and local variables of the function that is being stepped through.
Here is the general procedure for stepping through code:
Step through the displayed function by pressing any of the four buttons at the lower left of the Stepper Dialog (inside the Step box), such as the Next button to "step to the next form". For stepping quickly, it's handy to use the keyboard shortcuts for the buttons, such as alt-N to Step Next.
The Step Next button will proceed to execute the form that is currently displayed in the Form Pane (and usually highlighted in the Definition Pane), and then stop at the next form in the definition that is currently being stepped through. (The "next" form may actually be a form that contains the previous form, for example.)
The Step Into button will be available only when the highlighted form is a function call. It will step into the function that is called by the highlighted form, and then stop at the first form in that function. The new function will then be displayed in the Definition Pane, replacing the one that you were stepping through. You can then proceed to step through the new function. On returning from the inner function, the Stepper Dialog will continue stepping through the outer function.
Step Into is most suitable when the highlighted form in the Definition Pane has a green background, which means that the necessary debugging information is available for source-level stepping through the function that will be called.
The Return button will proceed to execute the displayed function or method without further incremental stops, allowing it to return normally. If the current function was called by another function that was also being stepped, then stepping will then continue through the calling function.
The Continue button will proceed with normal code execution, allowing it to complete. This is recommended whenever you're done stepping for now; otherwise the listener process will remain stopped at a step, which might interfere with other IDE commands. For example, while stopped at a step, the Tools | Incremental Compile command would queue up the new evaluation as usual until the current one has returned, and it may not be clear why the evaluation is not being done. The listener itself may be unresponsive while stopped at a step, unless you generate a fresh prompt with View | Debug Window menu command (the keyboard shortcut is F9).
Clarification: The bullets above for the four stepping buttons describe how the stepper will stop at "temporary breakpoints" that the stepper sets itself. In addition, the stepper will always stop at "user breakpoints" that you have set yourself (until you disable or delete the breakpoints). So you may need to use the Continue button a number of times to stop at all user breakpoints before stepping finally completes. Or to exit all stepping as quickly as possible, use Run | Remove All Breakpoint and then press the Continue button a single time.
In addition to setting breakpoints at the entrance to functions by using Run | Set Breakpoint, you can set breakpoints inside the function that is being stepped through now. To do this, move the mouse over the Definition Pane to highlight the breakpointable forms in the definition. When the desired form is highlighted with a blue border, left-click to breakpoint that form. The parentheses on the ends of the form will turn red to indicate that there is a breakpoint on that form. Left-clicking a form that is already breakpointed will unbreakpoint that form. Or right-click the form and select "Breakpoint" or "Unbreakpoint" from the pop-up menu that appears.
It can be useful to add a breakpoint somewhere past the highlighted form in the Definition Pane, and then to press the Continue button to proceed to that point. That's faster than stopping at all of the forms in between.
You can set breakpoints inside a definition without first breakpointing the entrance to the function by using Run | Show Definition in Stepper Dialog. That command will display a definition in the Stepper Dialog even though it is not being executed and stepped through (assuming that the function has been compiled for source-level debugging -- see The source stepper in debugging.html). You can then set breakpoints inside the definition before running code that will call the function and stop at those breakpoints.
When doing a step results in all of the stepper dialog panes turning blank and remaining so, it means that the evaluation has proceded without hitting another breakpoint. The code execution might be busy, but typically it will have completed. If the current test was initiated by evaluating a form in a listener or in the editor, you may want to check the listener at this time to see what final values were returned.
If you come to a place where you would like to edit the real source code, such as to fix a bug, then press the Edit button to show the displayed function or method in the IDE's source code editor. The code at the current step will be selected in the editor just as it is in the Definition Pane, and the selection will be updated in the editor during further stepping as long as that editor pane is left open.
If you would like to temporarily execute the test code normally without interruption, toggle the Breakpoints Enabled check box off to disable the currently defined breakpoints. Toggle it back on later to for another stepping test. If you toggle the check box off while stopped at a step, it will abort from the evaluation that is being stepped through. Note: Toggling the Breakpoints Enabled check-box while stopped at a step may not be working properly at this time, and may lead to a confused state.
When you are done stepping for the moment, it is recommended that you press the Continue button a number of times as needed until all stepping has completed, to let the process unwind from the code that was being stepped through. Once that has happened, toggling off the Breakpoints Enabled check box will avoid triggering the still-active breakpoints for now. And when you are completely done testing the current set of breakpoints, Run | Remove All Breakpoints will delete all user breakpoints.
The Definition Pane (at the top of the dialog) shows the source code for the function or method that's currently being stepped through. This is a copy of the real source code text, complete with comments and original line breaks. The form at which the stepper is currently stopped will be highlighted with a different background color. The meaning of the various colors is covered in a separate section below. Red parentheses are drawn around any breakpointed forms.
When the mouse moves over a local variable in the definition pane, the current value of the variable will now be shown in the message widget. This avoids often needing to scroll down to that variable in the list of all arguments and local variables.
The breakpointable form under the mouse (if any) in the Definition Pane will have a blue border drawn around it; this is the "selected object" in the pane to which commands on the right-button shortcut menu will be applied. Even keyboard shortcuts from the IDE's menu bar can be applied to the highlighted form. If the mouse is not inside the Definition Pane, then the form at which the stepper is stopped is the selected object to which IDE commands will be applied.
The Form Pane (second from the top) shows just the form at which the stepper is currently stopped. This form would be executed by a subsequent Step Next. Sometimes this is a form in the original source code, and is the same as the highlighted form in the Definition Pane, and at other times it is all or part of a macroexpansion. This form is shown pretty-printed by the lisp printer, and therefore is typically more compact than the highlighted form in the Definition Pane even when they are the same form. You could click on a symbol in this pane and then apply IDE menu bar commands to it, for example, as in the editor.
The Stack Pane (third from the top) lists the arguments and local variables of the function that is being stepped through, followed by the arguments to the function that called the function being stepped, and then by the arguments to the next calling function. When a new function is first stepped into, the arguments are listed first, whereas on subsequent steps the local variables are listed first; this is done so that the most pertinent information at each step is more likely to be visible when the Stack Pane remains scrolled to the top.
Whenever the value of a local variable changes during stepping, the new value will appear in this list immediately. A new variable value (and the variable name) will be shown in red text, with the previous value displayed beside it in parentheses, and the variable will be scrolled into view automatically. (When multiple variables have changed, only the first one may be scrolled into view.)
A new variable value will not be updated in this list if it is being held in a register for efficiency, rather than being stored in the variable's official location on the stack. You may see it updated here later if the new value is eventually moved to the stack, perhaps when the value is actually used.
You can click on a line of text in the Stack Pane (third from the top) to select the value of an argument or local variable. Then (as usual in the IDE) you can invoke any command on the IDE's menu bar on the selected argument or variable value; this will do something if that command makes sense on that kind of value. Or right-click a value to see a pop-up menu of suggested commands for that kind of value. Or double-click a value to inspect it in the IDE's Inspector.
As a debugging experiment, you can modify the value of an argument or local variable at any step, and then continue stepping with the replacement value. To do this, right-click the desired argument or variable and select Modify Argument or Variable from the pop-up menu. A modal dialog will then appear, where you can enter a lisp expression that will be evaluated to produce a replacement value for that argument or variable. You can then continue execution with the replacement value.
When the Include Dead Locals check box is checked, as it is by default, then the Stack Pane displays all local variables. When it is unchecked, variables that are "dead" at the current step are excluded from the list. A dead variable is one whose current value will no longer be used as the execution of the current function proceeds (though it may later be set to another value that will be used).
The form in the Definition Pane at which the stepper is currently stopped is drawn with a background color that can have different meanings. An explanatory note will appear in the dialog the first three times each highlighting color is used.
When the highlighting is blue, this is simply the default highlighting color that is used when none of the special colors below are in effect.
When the highlighting is green, it means that source-level debugging information is available for the function that the highlighted form will call. This is a "green light" that pressing the Step Into button will continue doing source-level stepping. The called function would then replace the calling function in the Definition Pane.
When the highlighting is yellow, it means that you can do a Step Into to step through the function that is being called on that step, though no source debug info is known for the function that is being entered and so it will be stepped through at the assembly language level. So this is a yellow light to do a Step Into with caution. When that function call returns, the stepper should resume stepping that current function at the source code level.
When the highlighting is orange, it means that you are stopped at a macro form. The next step may be affected by the current choice in the Macroexpansion Stepping Action group at the lower right of the stepper dialog. See the notes that are shown in the dialog's status bar as you move the mouse over those choices.
When the highlighting is gray, it means that no source code range is known for the current step point. The previously-highlighted form remains highlighted simply as a general landmark. Typically the higlighted code will be a macro form that you are still somewhere inside, but execution may actually be at some point beyond the gray highlighted form.
When the highlighting is purple, the highlighted form is a preview of a function call that will be made later, after its arguments are evaluated. To step into that function, you would first need to do more Next steps to evaluate the arguments. When the highlighting returns to this same form just before the call is really about to be made, it will be green or yellow to show that you can step into the function at that time.
Whenever the Definition Pane at the top has the keyboard focus, each of the three panes that display information may be scrolled with the keyboard using the usual vertical scrolling keys (PageUp and PageDown, Home and End, and the up and down arrow keys). If no shift keys are held down, then the Definition Pane is scrolled. If the shift key is held down, the Form Pane is scrolled, and if the control key is held down, the Stack Pane is scrolled.
Whenever execution stops at a step and the Stepper Dialog is selected, the keyboard focus is moved to the Definition Pane to facilitate scrolling the three content panes in this way.
When either the Definition Pane or the Stack Pane has the keyboard focus, Search | Find Forward (from the IDE's menu bar) can be used to search the pane for an arbitrary string, and then Search | Find Again may be used to find subsequent matches.
In the Definition Pane, Search | Find Forward will always start at the top of the definition. A string match will be highlighted with a light red background.
In the Stack Pane, Search | Find Forward will always start at the top of the list. Only variable names are searched for string matches. A line with a matching variable name will be selected.
Pressing the Tab key in either of these panes will move the keyboard focus to the other pane. A vertical gray bar is drawn just inside either of these pane's scrollbar when it has the focus.
If breakpoints are added to functions for which source-level debugging information is not available, and the Stepper Dialog is present when the breakpoints are hit, the Stepper dialog will still display some information and allow stepping to be done. The Definition Pane will still display the function source if the usual "source file information" is available, but will not highlight forms for the current step because they are not known. The Form Pane will display an assembly language form rather than a lisp form. And the Stack Pane will still display local variable values.
The Preferred Language Combo Box can be used to specify the language in which you would like to do stepping. The default setting is No Preferred Language, which will map to the highest-level language that pertains to the code being stepped. If you select Asm, then stepping will be performed at the assembly language level even where lisp source-level information is available. (Stepping through other languages such as Python may be possible in the future.)
When changing this setting, existing breakpoints will still be stepped in the language that was current when those breakpoints were added. You would need to delete and re-add those breakpoints to use them with the newly-selected language.
The Macroexpansion Stepping Actions radio buttons at the lower right specify what action to take when encountering a macro form. The choices are
Running the mouse cursor ove rthe choices displays documentation in the dialog status bar at the bottom of the dialog. The top-level command :help step typed to a Listener prompt will also provide documentation.
The dialog has two split-bar widgets for adjusting the relative size of the three content panes. When the resizing mouse cursor appears as you move the mouse between the panes, click and drag to adjust the sizes.
The file menu displays commands mostly dealing with opening, closing and saving files or groups of files (a project is a group of files). The commands on the menu are:
Creates an empty buffer in the IDE Editor for a new source code file (or other text file). You will be asked for a pathname for the new file the first time you invoke the Save command on this buffer.
Displays a New Form dialog which allows creating a new form and adding it to the current project.
Creates a new project, which is then known as the "current project" that is being developed in the IDE. The previous current project if any is closed (after prompting to save changes if needed).
The directory-choosing dialog first appears asking for a default directory for the project's files. A project's files do not have to be placed into this directory, but having a default directory allows the IDE to default the file-selecting dialog to a directory that typically is convenient. The immediate parent directory name will also be the initial name of the project and its .lpr project definition file; for example, if you specify the directory c:/allegro-projects/first/, then the next File | Save All that is done will save the project definition file as c:/allegro-projects/first/first.lpr. (The project name could be changed later in the Project Manager dialog's Options tab, and its pathname could be changed by invoking File | Save As while the Project Manager is the selected window.)
In addition, the first time a project is created there will be an earlier invocation of the directory dialog asking for a default parent directory for all new IDE projects. This default parent directory is used as the initially-selected parent directory whenever a new project asks for a default directory for that particular project. This dialog will not reappear as long as the allegro-ide-options.cl file is created and retained as usual, though the value could still be changed by setting the project-parent-directory configuration option.
The project system does not have to be used for an application, but is necessary for building form windows interactively, and for using the File | Build Project Executable and File | Build Project Distribution commands rather than writing a call to generate-application.
See also new-project-show-project-manager, new-project-show-editor, and new-project-create-form.
Displays a source code file (or other plain-text file) in the editor for viewing and/or editing, after displaying a dialog to ask for the file to open. If an editor buffer is currently selected and context-sensitive-default-path is true, then the file dialog will default to the directory of that buffer's file, if any, and otherwise will default as usual to the directory from which a file was most recently selected with the file dialog. (On the very first invocation of the file dialog, the directory defaults according to start-in-allegro-directory.)
The contents of the Files of Type field of the dialog is controlled by the value of the IDE configuration option source-file-types. That option controls the type field for this File | Open command and for the dialog displayed by the File | Save As when saving an Editor file.
Displays a dialog for choosing an existing project to further develop in the IDE. The project is then known as the current project. The previous current project if any is first closed (after prompting to save changes if needed). If any of the project's form windows were visible (not shrunk) when the project was last saved, then the first such form will be inspected in an Inspector window.
If the open-project-show-files-in-editor configuration option is true, then each of the project's source code files will be opened in the editor. The Project Manager will be shown if open-project-show-project-manager is true. The project's code will be compiled and loaded according to the current value of the open-project-action option.
There is also an Open Project item on the Recent menu. It displays a submenu of projects that have recently been opened, loaded, or saved, either in the current invocation of Lisp or a recent one. Selecting one of the projects opens it as the current project for editing.
Close the current editor buffer in the editor workbook. If the pane being closed is the only pane, the editor workbook is closed as well.
Closes the selected window. Do not use this command to close a buffer in the Editor workbook as it will close the entire workbook, not just a single buffer. Use File | Close Pane to close an editor buffer.
Displayed when a dialog is the selected window. Closes all dialogs except the Inspector (and the Debug window, Editor Workbook, and any forms). The result is the screen has roughly the same windows as when Allegro CL starts. All dialogs can be reopened later, of course.
Displayed when an Inspector window is selected. Closes all Inspector windows. Display a new inspector with View | New Inspector.
Displayed when a form is the selected window. Closes all forms. File | Save All creates a new, blank form.
Displayed when the Editor workbook is the selected window. Closes all editor workbooks. View | New Editor displays a new editor workbook (whether or not one currently exists).
Displayed when a class graph window (as displayed by, say, Tools | Graph Sunclasses) is selected.
Displayed when a analysis graph window is selected. Closes all runtime analyzer graph windows.
Saves the contents of the currently selected IDE window to a file, if that window supports the Save command.
When the editor is selected, the text in the selected editor buffer is saved. If a new buffer is being saved for the first time, the file dialog will first ask for a pathname for the file. If the editor buffer is for the .cl file that is associated with a form window, then the form's .bil file is also generated at this time (see maker-function).
If there is a current project, you will first be asked whether you would like to add the new file to the project. If you answer yes, then the file dialog will default to the current project's default directory, and the file will be added to the project after it is saved. If you answer no, then the file-selecting dialog will default as it otherwise would to the directory in which a file was last selected in the file dialog.
The Save command may also be used in certain other IDE windows. For example, when the focus is in a listener in the Debug Window, the text in the listener will be saved. In a form window, the form's .bil file is generated (see maker-function) and its associated .cl file in the editor (if any) is saved. In a stack backtrace, a bug report that contains the stack information will be written. In the Trace Dialog's outline widget, the trace information will be written as indented text. In the Inspector, the currently displayed table of values will be written. In the Project Manager dialog, the current project's .lpr project definition file will be written.
In some windows (the Class Browser, the Trace Dialog, the Runtime Analyzer Results dialog, the Inspector panes, and the backtrace pane in Debug Window after an Error) the text is actually written to a new editor buffer rather than to a file, to avoid the requirement to specify a pathname and create a file when you just want to view or copy the text. You can then use this same Save command in the editor buffer if you do want to save the text to a file.
Generally does the same thing as the Save command, except always first asking for a new pathname.
You cannot use Save As when the Project Manager Dialog is the selected window. Save in that case saves the current project's .lpr project definition file, but that file should have the same filename as the project name, so it is inappropriate to use this command to modify the filename. Instead, change the name of the project (in the Options tab of the Project Manager) and say yes when asked if you want the .lpr name changed as well. To move the project files to a new directory, close the project, copy all the project files to the new directory using standard Operating System tools (such as the Windows Explorer) and then reopen the project from its new location.
Saves each editor buffer and form window that has unsaved changes, as well as the current project's .lpr file when there are unsaved changes to the project itself. When the file dialog appears to ask for a pathname for an object that has not yet been saved (perhaps a scratch editor buffer), canceling the dialog will skip that object without canceling the saving of other objects. A status-bar message will mention which objects were saved and which were skipped, or that nothing needs to be saved. This menu command is also on the right button menu (shortcut menu) over the background window. See View | Background Window.
Replaces the current contents of an editor buffer with the contents of the file associated with the buffer. Changes since the last save are thus discarded.
Displays a dialog to choose a Lisp source file to compile. The file is not loaded after compilation.
Displays a dialog to choose a file to load. The file must be either a compiled Lisp file (fasl file), a lisp source code file, or a .lpr project definition file. If a fasl file or source code file is specified, then cl:load is called on that file directly. If a project definition file is specified, then load-project is called to load the project. (A loaded project may be used in the IDE, but is not the "current project" that is open for further development.)
Displays a dialog to choose a Lisp source file to compile. The compiled file is then loaded.
Creates a standalone executable file for the current project in the main directory of the project. (An associated dxl file is also created, which gets loaded by the executable file.) This allows running the application by itself, outside of any development environment. The license file devel.lic is copied to the project directory from the Allegro directory, allowing the project executable to be run. Note that this directory is not suitable for distribution under a VAR agreement (use File | Build Project Distribution for that).
If the name of the project (as specified on the Options tab of the Project Manager dialog) is my-application, for example, then the executable file will be named my-application on Linux or Mac, or my-application.exe on Windows. The dxl file will be named my-application.dxl.
build-lisp-image is used to build the new image.
See also build-project, which is a programmatic equivalent of this menu command.
This command does everything that Build Project Executable does, and then also collects all files that are needed for distributing the application to others into a directory that you specify. A license file suitable for distribution under a VAR agreement is also placed in the directory.
The default distribution directory will be a subdirectory of the project's main directory named dist. The additional files will include a license file, plus any shared libraries that are internally known to be needed, along with any libraries and other arbitrary distributed files that you have specifically added to the project.
generate-application is called to do much of the work of this menu command.
See also build-project, which is a programmatic equivalent of this menu command.
Displays a dialog for setting up a page of the printer.
Prints the contents of the currently selected IDE window or widget, if that window or widget supports the Print command. This is typically used in the editor to print a source code file.
Exits Allegro CL and the IDE.
The Edit Menu contains commands that mostly deal with editing text although some commands are appropriate for non-text objects (Edit | Cut and Edit | Copy) work on components on a form, e.g.) The commands on the menu are:
Undoes the last edit-like operation, if possible. See undo-command.
When running in a web browser (and thus always on Linux and the Mac), you must type the keyboard shortcut (Control+Z or Command+Z) rather than showing the menu and selecting the command there.
Redoes the last undone edit-like operation on text-edit-panes, if possible. Only available on Windows. See redo-command.
When running in a web browser (and thus always on Linux and the Mac), you must type the keyboard shortcut (Control+Y or Command+Y) rather than showing the menu and selecting the command there.
Deletes the current selection and places it on the clipboard so it can be pasted.
Copies the current selection to the clipboard so it can be pasted.
Pastes from the clipboard to the current location in the currently-selected window. Usually, text is pasted but controls on a form can also be copied or cut and pasted. See also Edit | Pop and Paste below.
Pops the topmost item off of the Lisp clipboard stack, and then pastes the item that is now at the top of the stack. Doing a Edit | Paste followed by a Edit | Pop and Paste, for example, would paste the two most recently copied objects.
Deletes the current selection without placing it on the clipboard (so it cannot be pasted).
Selects all text in a text buffer.
Displays a submenu with UPCASE, downcase, and Capitalize as the commands. Choosing one changes the selected text as desired. Only alphabetic characters are affected. Capitalize typically leaves words like the and a downcased, but the first selected letter is always upcased.
Comment in indents any selected text and puts semicolons at the line beginning making the text into a comment. Comment out uncomments text which was commented in. This is a rote command so commenting out text which was not first commented in has undefined effect.
Rearranges the selected code in a text buffer with traditional Lisp indentation. The pretty-printer configuration property, set directly or with the Pretty Print field on the Editor tab on the Options dialog, affects this command. If the value of that field is :reindent, reindenting will change the indentation of each line but not move things between lines. If the value is :pretty-print, the number of lines and their contents may change to provide the optimal result. The reindenting is simply for appearance. No syntactic changes are made to the code, of course. If reindenting a large form is taking too long, it can be interrupted by pressing the Escape key. The form may be left partially reindented, though, if indentation is interrupted.
Allows you to insert an untypable character either into the editor or into any other text-editing widget in the IDE. A dialog of all characters in the Latin1 character set is shown, and the one that you select will be inserted. This may be useful, for example, in the modal Search | Find Forward or Search | Find Backward dialog or the Search | Find Definition dialog. For single-line editable-text controls, you may need to use the Control-Q keyboard shortcut rather than showing the menu, or else the current text cursor position will not be retained for the insertion.
Colorizes the top-level definition that surrounds the text cursor in the editor. The IDE never saves colorization into the file that is written from an editor buffer. See the colorize-source-code and the Editor Color tab on the Options dialog.
Colorizes all of the source code in the currently selected editor buffer. See the colorize-source-code and the Editor Color tab on the Options dialog.
The next four commands macroexpand selected forms. The IDE macroexpansion commands are useful only when a complete lisp expression is selected. They are typically used in the IDE Editor, where a lisp expression may be selected by double-clicking immediately to the left of the expression's opening parenthesis. The expanded source code is printed to the Debug Window.
Macroexpands the top-level selected macro call a single time, by calling macroexpand-1.
Macroexpands the top-level selected macro call iteratively, by calling macroexpand. That is, if the initial expansion produces another top-level macro call, that call will also be expanded and so on, but non-top-level macro calls elsewhere in the form will not be expanded. See Edit | Walk Form, which recursively macroexpands all subforms.
Does a complete macro expansion of the selected form by recursively macroexpanding all macro calls in the selected form. The related Edit | Compiler Walk Form does the same but also considers compiler macros and performs certain other compiler transformations to the source. (Thus, Walk Form applied to (list 1), displays (list 1), because the compiler-macro associated with list is ignored.)
Does a complete macro expansion of the selected form by recursively macroexpanding all macro calls in the selected form, taking compiler-macros into account and performing certain other compiler transformations to the source. Contrast with the related Edit | Walk Form.
(Thus, Compiler Walk Form applied to (list 1), displays (cons 1 nil), because the compiler-macro associated with list is used.)
The final four commands deal with the mark (a specified location in text) and with selected text.
The first two commands, Edit | Set Mark and Edit | Swap with Mark, may be useful for returning to a buffer position after some other IDE command scrolls the buffer away from it. For example, if the Search | Find Definition command shows a definition in a pre-existing editor buffer, it first sets the mark before scrolling to the new definition. This allows using the Edit | Swap with Mark command to toggle between viewing the newly-found definition and whatever was being viewed in the same editor buffer beforehand.
Establishes a bookmark (called simply "the mark") at the current text cursor position in the selected editor buffer. The mark is used by the other mark-related commands Edit | Swap with Mark and Edit | Select to Mark. In particular, Edit | Swap with Mark scrolls the buffer back to the mark.
There is only a single mark that is set by the interactive commands, though multiple marks may be set programmatically (see make-mark). Marks know how to retain the same logical position within the text when text before the mark is inserted or deleted.
Sets the selected editor buffer's mark to the current text cursor position, and moves the text cursor to the previous mark position, scrolling the buffer as needed to show that position. In other words, after the mark is set at one position (see Edit | Set Mark) and then the text cursor is moved to some other position, repeatedly invoking Swap with Mark toggles between viewing the two areas of the editor buffer around these two positions.
Selects the text in the selected editor buffer between the current text cursor position and the mark position (see Edit | Set Mark). This command may be useful for selecting a large range of text which cannot be scrolled entirely into the editor window.
Scrolls the selected editor buffer so that the currently selected text (or the current text cursor position if no text is selected) is in view. (The text cursor position may not be in view if, for example, the scrollbars have been used to scroll it out of view.)
The Search Menu contains commands for finding text or objects. The commands on the menu are:
Displays the Find dialog for searching for a string in the currently selected window or widget. The Search Backwards check-box on the dialog will initially be deselected, to search from just after the current position toward the bottom of the window. If the incremental-search configuration option is enabled and an editor or listener window is selected, then the Find dialog is not shown and a forward incremental search is begun immediately. If the string is found, it is selected. If it is not found, a message dialog appears unless the warn-on-no-action-taken configuration option is nil. When a string match is selected, editor-string-search-lines-of-padding additional lines of text will be scrolled into view for context.
Like Find Forward except that the Search Backwards check-box on the Find dialog will initially be selected, to search from just before the current position toward the top of the window (or a backward search is initiated immediately in incremental-search mode).
Searches for the next occurrence of the current search string in the current search direction, as specified most recently on the Find dialog or Replace dialog. (If an editor window or listener is currently selected, then the current search direction may also be reversed with the reverse-search-direction-command key binding -- see the Shortcut Keys dialog).
Finds in the currently-selected object (usually a text-edit buffer) what is on the clipboard.
Displays the Replace dialog allowing you to specify text to find and text to replace it with. Unlike the various Find commands, the Replace command is applicable only in the editor and other text-edit-panes.
Replaces the next occurrence of the current search string with the current replace string, as specified most recently on the Replace dialog and/or Find dialog. The replace is done in the current search direction.
Displays the Find In Files dialog for finding all occurrences of a specified string in the source code files of the current project or an arbitrary directory.
Displays the Definitions dialog for listing the functions, classes, and variables that are named by a symbol, and optionally editing their source code. See also the Search | Quick Find Definition menu command.
Opens the file containing the definition of the object (operator, variable, class) named by the currently selected symbol. If more than one type of object is named (a function and a class, for example), a lettered menu listing the choices is displayed (see pop-up-lettered-menu). If the system does not know where the definition of an object is or the selected symbol does not name an object, a beep is sounded and a message appears in the status bar. You can always use the Definitions dialog (displayed with Search | Find Definition for a more exhaustive search). If a definition appears in an unsaved editor buffer and the object is known to Lisp (because, for example, the definition has been compiled), then the system will use what information it has to find the definition but may fail to find the correct buffer or fail to find the definition in the buffer (in which case messages to that effect will be displayed in the status bar). Saving the buffer to a file will allow the definition to be found.
Displays the Apropos dialog for finding all symbols that contain a specified substring.
Displays a menu (or a Select a Completion dialog if there are a lot) showing possible completions of the symbol being typed. If there is only one completion, it is pasted with no menu or further action.
The View Menu contains commands that display or hide windows. The commands on the menu are:
Displays a submenu of window-management choices, mostly affecting the currently-selected window. Among the choices are
Ctrl-Alt-J) is handy for quickly switching back and forth between two IDE windows.Ctrl-Alt-K) is handy for quickly switching between three IDE windows.Ctrl-Alt-L) is handy for quickly switching between four IDE windows.This View menu item displays the Project Manager dialog.
This View menu item displays the Editor workbook.
This View menu item displays the Debug Window.
This View menu item displays the Clipboard dialog showing the contents of the clipboard.
This View menu item displays the Processes dialog.
This View menu item displays the Console window.
This View menu item displays the Package List dialog.
This View menu item displays the Window List.
This View menu item opens a listener as an additional pane in the Debug window. The new listener will run in a separate thread, named Listener <i>X</i> where X is a number. You can close the new listener with the File | Close Pane while the listener is the selected window, or by clicking on the close box (the control labelled with an X in the upper right).
This View menu item opens a new Editor workbook (a tabbed collection of text-edit buffers). Current editors are unaffected.
This View menu item opens a new Inspector window, leaving any current Inspector windows in place.
This View menu item displays the extended (floating) toolbar. See IDE User Guide, chapter 2, section 2.3 for information on how to move items from the extended toolbar to the standard toolbar already on the Project Window.
This View menu item toggles between displaying and hiding the toolbars on the Project Window. Checked if they are currently displayed.
This View menu item toggles displaying and hiding the status bar on the Project Window. Command is checked if the status bar is currently visible.
This View menu command (which will appear only if the use-ide-parent-window configuration option is nil) displays a background window below IDE windows to prevent displays from other applications from showing through. Clicking right over the background window displays a menu showing other visible IDE windows and allowing the background window to be maximized (to cover the screen) or unmaximized (just big enough to be a background for windows other than the Project Window). Also on that menu is a Save All command with the same effect as the Save All command on the File menu.
This View menu command will toggle whether the IDE parent window is maximized to fill the screen or web browser tab.
The Tools Menu displays commands that control various tools in the system, or displays dialogs that control or report on tools. The commands on the menu are:
Compiles any files of the current project that are out of date. (I.e. those which have no compiled version or those whose compiled version is earlier than the source version.)
Compiles all files associated with the current project.
Compiles and evaluates the selected form or forms. A form is selected if it is highlighted or if the cursor is within it or just after the final parenthesis. See the description of the Editor workbook for more information on this command and the IDE editor.
Evaluates the selected form or forms. A form is selected if it is highlighted or if the cursor is within it or just after the final parenthesis. See the description of the Editor Workbook for more information on this command and the IDE editor.
Evaluates the top item on the clipboard. The shortcut for this command is control-shift-Q.
Displays the Class Browser dialog. If the current selection is a symbol naming a class, that class is browsed but the dialog displays whether or not it can determine the class of interest.
Displays a graph of subclasses of the class named by the currently-selected symbol. Displays nothing if the current selection does not name a class.
Displays a graph of superclasses of the class named by the currently-selected symbol. Displays nothing if the current selection does not name a class.
Inspects the currently-selected object.
Inspects the value of *.
Displays a submenu of things to inspect:
Returns (to the Debug window) and sets the value of * to the currently-selected object, usually text or a control on a form. The variable *selected-object* will also hold the value that was returned by the most recent use of this command. The value of *selected-object* will be effected by other uses of this command but will not be affected (as * will be) by evaluations in the Debug window.
Changes the cursor to a cross. Returns to the Debug window and sets the value of * to the next object clicked over.
Displays the Options dialog.
This command, if chosen, saves the current options (the current values on the Options dialog and the current window positions and sizes and which windows are visible) to the file allegro-ide-options.cl. This command is useful if you wish to arrange things as you want them to come up, and then want to be free to make changes for the current session only (such as moving, resizing, or hiding windows). If you use this command, you may want to toggle the Save Options on Exit switch on the Tools menu to off (unchecked) so options are not again saved on exit, perhaps overwriting what you saved now. See The user options file allegro-ide-options.cl in cgide.html for more information on the options file.
This command displays whether options (the current values on the Options dialog and the current window positions and sizes and which windows are visible) will be saved to the file allegro-ide-options.cl when Allegro CL exits. If this item in the menu is checked, options will be saved on exit; if it is unchecked, options will not be saved on exit.
If options are saved, the IDE will come up with all standard windows sized and positioned as they were on the last exit. Some users like this feature. Others prefer to have the IDE come up in a specific fashion, and to then be free to move and resize windows as desired during the current invocation without having such changes affect the next invocation.
To ensure that Save Options on Exit is toggled off when the IDE starts, toggle it off and choose Tools | Save Options Now.
The Run Menu displays commands for testing forms and projects and for using tools that affect or report on how a program runs. The commands on the menu are:
Run the current project by calling the project Init Function. The default project init function creates and displays the main form.
When you run a project (as opposed to running a single form with Run | Run Form), the windows of the project are created in their own window hierarchy (or hierarchies), completely separate from IDE window hierarchy. This is done so that running the project from the IDE will emulate the eventual standalone application as closely as possible for more complete debugging.
But this also means that IDE keyboard shortcuts are not available while the running project windows are selected, and the entire running project may get buried behind the IDE, since the whole IDE is always either in front of or in back of the entire running project. You can switch between the running project and the IDE as you would between two applications, by using the Windows Task Bar or the Alt-Tab gesture.
The behavior is different when running a single form (with the Run | Run Form. command). In that case, the running window will be owned by the invisible IDE owner window, and therefore it can be intermingled among the various IDE windows and you can still use IDE keyboard shortcuts and so on. If you run a project when it is already running, the current running instance is first halted (and its windows are closed) and then the project is run again from scratch.
Run the currently-selected form; that is, create and display the window associated with the currently-selected form.
When you run a form, the running window for the form is owned by the invisible IDE owner window. Therefore, the running window behaves as if it were part of the IDE. That is, the window may be intermingled among the various IDE windows, and the IDE keyboard shortcuts may still be used. This is done so that the IDE is still conveniently available while quickly testing single forms.
This behavior is different from the behavior when running the whole project by choosing the Run | Run Project menu command or clicking the Run button on the Toolbar. When a project is run, the project's windows are created in their own hierarchy completely separate from the IDE, so that the running project will emulate the eventual standalone application as nearly as possible for more complete debugging.
If you run a form which is already running, the current running window is first closed, and then it is created and run again from scratch.
Stops the running form or project and removes the active windows built from forms.
Tries to interrupt current computation. It may be what needs to be interrupted prevents the Run menu from displaying. The keyboard equivalent on Windows and Linux is the Pause key. On the Mac, it is Command-B. Pressing the keyboard equivalent will usually perform the interrupt.
Like Run | Run Project, with additional behavior to perform a runtime analysis of the run. This command wraps a call to with-profiling around the running of the project, and will analyze only the process of the running project. When the project run exits (typically by closing the project's main window), it will also automatically display the new analysis in the Runtime Analyzer Results dialog. The Runtime Analyzer is described in runtime-analyzer.html.
Starts tracing the currently selected symbol.
Stops tracing of the selected symbol.
Stops all tracing.
This command on the Run menu causes functions that were being traced when Run | Untrace All was chosen to again be traced. Also, if choosing Run | Untrace resulted in nothing being traced, Retrace causes the last object traced to be traced again.
Prints information about what is being traced to the status bar.
Displays the Trace Dialog.
Add a breakpoint at the top of the selected function or method, if any, as with the top-level :break command. This is typically used to set up stepping with the Stepper Dialog.
If the selected object is the name of a generic function, then a pop-up menu will appear asking which method to breakpoint; the special All choice will breakpoint all methods of the generic function.
If the Stepper Dialog is currently selected, and the Definition Pane has the keyboard focus and is highlighting a selected form, then the breakpoint will be set on the selected form inside the function being stepped through. The selected form is the one under the mouse if any, and otherwise the form at which the stepper is stopped.
Remove the breakpoint at the top of the selected function or method, if any. (Or the breakpoint on the selected form in the Stepper Dialog as with Set Breakpoint above.)
Remove all currently-defined breakpoints.
Print a list of the currently breakpointed functions to the listener.
Display the Stepper Dialog for stepping incrementally through the source code of compiled application functions and methods, stopping at breakpoints.
Displays the source code of the selected function or method in the Stepper Dialog, if it has been compiled for source-level debugging (see The source stepper in debugging.html). You can then set breakpoints inside the definition, without breakpointing the entrance to and exit from the function as the Set Breakpoint command does.
In the editor when no text is selected, the definition that will be used will be the one that the text cursor is currently inside, and the stepper dialog will scroll the editor's text cursor position into view. Otherwise if a function object can be derived from the selected object in the selected IDE window, then its definition will be used.
Displays a submenu with the following choices:
Displays the Runtime Analyzer Control dialog, which provides tools for controlling the runtime analyzer.
Displays the Runtime Analyzer Results, which displays information about runtime analysis data.
When checked, the IDE is more responsive to user gestures while user code is being evaluated, but responsivess of other applications may be reduced in certain cases, such as glitches in music playback during a dragging operation in the IDE on Windows. See ide-priority for more information.
The Form Menu contains commands that affect the appearance of the current form. The commands on the menu are:
Displays the Widget Palette, which is a small window containing buttons for the various kinds of widgets that you can add to a form window to design a dialog interactively. To add a widget to a form, first click the button for the desired type of widget in the palette, and then click on a form to add an instance of that type of widget to the form. Alternately, use Form | Add Component.
You can also display the palette by clicking in the background area of a form window, unless the show-widget-palette-when-click-form option has been turned off.
If the widget palette overlaps the selected form window when the palette is displayed, it will automatically be shifted off of the form window so that it doesn't get buried by the form.
Displays, in an Add Component dialog, a list of components and adds the selected one to the current form.
This command is on the menu when the selected form does not have a menu bar.
This command adds the default menu bar to the form and displays the Menu Editor dialog. If you cancel the Menu Editor, the menu bar is not installed on the form.
If the form already has a menu bar, this command will not appear on the Form menu. Instead, the command Edit Menu Bar. See also the Remove Menu Bar menu command.
This item is only present when the current form has a menu bar. If the current form does not have a menu bar, the Add Menu Bar command will be on the Form menu instead. This command displays the Menu Editor dialog for the menu bar on the form.
See also the Remove Menu Bar command.
Removes the menu bar from the current form, if there is one. See also the Add Menu Bar command and the Edit Menu Bar command.
Displays a Tab Order dialog allowing you to specify the tab order of controls on the current form. When the form is run, pressing tab will move focus among controls. The order in which focus moves among controls can be set by this dialog. See tab-position.
(Note that keyboard shortcuts can be used to jump to a control with a keypress. The keyboard shortcut is defined by placing a tilde (~) before the keyboard shortcut letter. The keyboard shortcut is then Alt-[the letter]. The static-text control cannot have focus so if its value has a tilde before a letter, that provides a keyboard shortcut to the next control in the tab order. See the discussion Using a static text as a keyboard shortcut to jump to a control in the static-text entry.)
Arrange the selected components so they are equally spaced.
Show alignment cues for aligned controls.
The Install Menu contains commands that either download new patches to lisp itself, or download and install the latest version of particular add-on products. The commands on the menu are:
Displays the Download Patches dialog for downloading all or selected Allegro CL updates.
The Recent menu allows editing or loading recently-used projects, files, and source code definitions by simply selecting them from a history list rather than re-browsing for them from scratch. This is especially useful for retrieving things that were being used in the previous invocation of lisp, since they are no longer present upon restarting Lisp.
The number of items in each submenu is the value of the recent-limit configuration property.
The submenu for each history list will be unavailable (grayed out) if there is nothing in the history for that type of item. This will be the case in a freshly installed Lisp, or in a fresh invocation of Lisp if the allegro-ide-options.cl file was deleted (since the history lists are kept there along with the configuration options).
If a submenu contains the same file name more than once, this indicates distinct files in different directories. To find out which file is which, hold the mouse briefly over the submenu until the tooltip appears with the full pathname for the menu-item currently under the mouse. (The tooltip delay is controlled by the menu-tooltip-delay configuration property, which defaults to 1500 milliseconds.)
The items on the menu are:
Displays a submenu of projects that have recently been opened, loaded, or saved, either in the current invocation of Lisp or a recent one. Selecting one of the projects opens it as the current project for editing. See also File | Open Project, which prompts for a project to open.
Displays a submenu of projects that have recently been opened, loaded, or saved, either in the current invocation of lisp or a recent one.
Selecting one of the projects loads it for general use in the IDE.
A project may be loaded initially either with the File | Load menu command or by calling the function load-project. Any number of projects may be loaded simultaneously in the IDE for testing or for use as utilities, though only a single project may be the current project, and thus opened for development.
Displays a submenu of files that have recently been opened in the IDE editor, either in the current invocation of Lisp or a recent one. Selecting one of the files edits it in the IDE editor. (If the file is already in the editor, it is found there rather than creating a second editor buffer.) The file may have originally been edited either directly from the File | Open menu command, or indirectly, for example from a Search | Find Definition command or Search | Find in Files command.
Displays a submenu of files that have recently been loaded into the Lisp environment, either in the current invocation of Lisp or a recent one. The file must have originally been loaded with File | Load (or its toolbar button). Selecting one of the files loads the file.
Displays a submenu of source code definitions that have recently been edited in the IDE editor. The definition must have originally been edited by using the Search | Find Definition, the Search | Quick Find Definition menu command, or the Search | Find in Files menu command or one of their shortcuts. Selecting one of the definitions edits its source code in the IDE editor.
Note that this particular Recent submenu will not retain its history from one Lisp session to another, unlike the other Recent submenus. This is due to problems with reloading function name symbols into a fresh lisp where the symbol packages no longer exist. The history is still available within a given Lisp session though.
The Help Menu displays commands that display documentation or other information about the currently selected object or about the system. The commands on the menu are:
Display the html page for the currently selected symbol. If no help page exists, displays a dialog saying that. If multiple pages exist (because, e.g., the symbol names more than one type of object), a dialog displaying the choices appears. This and some of the other Help Menu commands display help in your default HTML browser program by calling the function invoke-html-browser.
Displays the documentation for the selected dialog.
This command displays the Allegro Tree of Knowledge dialog, which displays a map to the available documentation in outline format.
This command displays, in an HTML Browser, the introduction to the Allegro CL documentation, introduction.html.
This command displays in an HTML Browser introduction page of the ANSI CL Spec (located in the ansicl/ subdirectory of the Allegro Directory).
This command displays, in an HTML Browser, the index to the Allegro CL documentation, index.html. (The index lists all documented symbols along with other material.)
This command displays, in an HTML Browser, the permuted index to the Allegro CL documentation, permuted-index.html. This indexes each symbol and topic under each "word" of the symbol name or topic phrase. For example, the symbol effective-background-color can be found alphabetized by background-color and color in addition to effective-background-color.
Display the Shortcut Keys dialog showing shortcut keys.
Run a high-level interactive introduction to the variety of development tools that are available in the IDE.
Display the Navigator dialog.
Display the Navigator dialog open to the Examples tab.
Displays the Navigator dialog open to the Tutorial tab.
Prints information about the currently-selected symbol to the status bar of the Project Window and (unless the selected symbol is in the Debug Window) to the Debug Window.
Prints information about the currently selected symbol (which should name a class) to the status bar of the Project Window and (unless the selected symbol is in the Debug Window) to the Debug Window.
Print to the Debug window the results of applying describe to the current selection.
Prints the Function documentation string, if any, to the Debug window. Note that most Allegro CL and IDE objects do not have documentation strings.
Displays a dialog allowing you to choose what processes to get backtraces for, asks additional questions about what to include, and then allows you to choose a filename for the bug report file. The file, when written, can be included in a problem report to technical support (see Reporting bugs in introduction.html for where to send bug reports).
Displays the Franz Inc. home page (which has technical as well as marketing and sales information) in a browser.
Displays a dialog with information about the current version of Allegro CL.
The Windows menu includes any existing non-shrunk top-level windows that are in the IDE, which means, owned by the invisible main IDE owner window (which is the value of (development-main-window *system*)) and which are not otherwise accessible from the IDE menubar without causing other side effects.
Choosing an item from this menu exposes the window and gives it the keyboard focus. A window may be selected with the keyboard by first typing Alt-W to drop down the menu, finding the desired window in the list, and then typing the single-letter at the left of the menu item.
Windows on this menu will include forms and their running windows when the Run | Run Form command is used, any windows created programmatically by the user in the IDE when the parent arg defaults to (development-main-window system), and some of the standard IDE dialogs when the usual command for invoking the dialog causes effects other than simply exposing the dialog. The right-click shortcut menu on the IDE Background Window (when it is present) continues to list the windows that are accessible from the Windows menu as well as from other pull-down menus (especially the View menu), since it is an alternative to using the menubar altogether.
Copyright (c) 2023, Franz Inc. Lafayette, CA., USA. All rights reserved.
|
Allegro CL version 11.0 | ||||||||